

Self-checkout loss report 2026
Foreword
We have been studying self-checkouts for over a decade. Our research in 2018, was the first published data on the scale and nature of losses retailers can expect, based on aggregated data from thirteen retailers.
At the request of our retailers, we asked Professor Matt Hopkins to update the original research and in this new report, based on responses from thirty-nine retailers, we share updated data points on the scale and nature of losses associated with self-checkouts, and new data on the effectiveness of the different design, people and technology-based interventions that can improve scan accuracy and reduce loss.
What this new report provides is an encouraging update for retailers looking to, or already deploying self-checkouts, with new data suggesting that the expected lifts in losses associated with self-checkouts are lower than reported in 2018, while for the first time, reporting on new indicators on the effectiveness of different design, people and technology interventions on loss reduction.
We encourage all retailers, whether they are just starting or have been deploying self-checkouts for decades to reflect on the findings in this report, and their relevance to their business.
Perhaps most of all, with an eye on the next report, we ask retailers to consider how they can more accurately measure, record and document the impact of self-checkouts on loss, and the effectiveness of the self-checkout interventions. Such data will be invaluable for our next study on SCO losses.
I would like to thank Professor Matt Hopkins for carrying out this research and to all the retailers who shared data and helped contribute to the thinking and the findings presented in this report.
As with all the research undertaken on behalf of ECR Retail Loss, it would not be possible without the active support and involvement of the retail community and by working together we can sell more and lose less.
Best regards
John Fonteijn
Chair: ECR Retail Loss
Executive Summary
This report presents findings from the largest study to date that measures the impact of self-checkout on retail losses. It builds upon the work completed by Beck (2018) that focused on data from 13 retailers with a combined turnover of €586b, with now new data from 39 retailers with a combined turnover in excess of €1 trillion. It includes data from seven of the top 30 turnover retailers globally.
The core aims of the study were to:
- Explore the current scale and nature of loss from SCO;
- Gather data on the impact of interventions.
The key findings show that:
- Of the 39 retailers returning data, it was evident that, in stores where SCO is present, this is now often the preferred form of customer transaction. In stores with SCO, an average of 54% of transactions now go through SCO.
- Analysis of loss data before and after SCO implementation estimates an average difference of +0.26 percentage points in the first year of operation. It is also observed that SCO increases loss by an average of 22% in the year after implementation.
- It is estimated there is a percentage difference of +0.42 percentage points between stores with SCO when compared to those without SCO. It is also observed that losses are 33% higher in stores with SCO. This is a lower difference in loss than previously reported in 2018.
- For every additional 1% of transactions through SCO there is between 0.030% to 0.048% of additional loss. This is higher than the 0.01% figure reported in 2018.
- Missed-scan is the most frequent source of loss (1-4.8% of transactions), though walkaways generate the highest loss (€88 where loss is sustained).
- Estimates of the proportion of non-scan events that are driven by malicious customer intent vary widely — from 6 to 80%. This suggests the methods used by retailers to estimate malicious intent are not reliable.
- For every additional 10,000 transactions there will be 1,000 additional help calls to staff, 100 card payment issues, 90 walkaways and slower staff reaction times (over 2 seconds).
- Stores in higher-risk locations, in areas of high population density, those with a young customer base with higher-than-average disposable income are most likely to record the highest losses.
- SCO loss as a percentage of total store sales and SCO loss as a percentage of all business losses are estimated to have increased since 2018.
- Though the data are very limited, a range of interventions show positive impacts on loss — especially exit gates, personal display monitors, and missed-scan ID. Retailers also indicate that some people-based interventions — such as staff monitoring SCO areas are important, though there is a lack of hard data to support this. The evidence shows that turning off weight scale controls increases loss.
The study also begins to conceptualise how loss happens at self-checkout and how this might be mitigated. This is illustrated in the diagram below. There are clear causes, customer motivations, perceptions and frustrations that can generate loss. However, a key aim for retailers going forward is to increase risk perception and a sense of control for those customers with malicious intent, but also to reduce the likelihood of error and frustration for well-intentioned customers.

How loss happens at self-checkout
Finally, although this report demonstrates how SCO generates loss, it also suggests these losses appear to be ‘manageable’ when the correct interventions are put in place.
With the next study in mind, we believe there are four key areas of improvement for retailers to consider:
- There needs to be development of more accurate measures of SCO loss and the wider impact of SCO on the business: Shrinkage is a ‘catch-all’ measure so can only ever be a proxy for SCO loss. This study has relied on shrinkage but recognises that not all store losses could and should be attributed to SCO. Future work should isolate SCO-specific losses, perhaps through computer vision analytics rather than store-level shrinkage comparisons, and factor in the wider costs, such as the impact on inventory accuracy and on-shelf availability, that current measures miss.
- Retailers need to better understand how individual store factors are associated with SCO loss: This study points to clear links between SCO loss and store-specific factors: location, customer demographics and exposure to crime, which might influence where to implement SCO. But our sample size was relatively small. A larger, multi-retailer dataset is needed to map how store-based factors (such as staff turnover and footfall) and external factors (such as catchment characteristics and local crime rates) shape SCO loss at store level. This is the evidence retailers need to make better decisions on all of the risk factors associated with SCO, to help decide where SCO belongs and where it does not.
- More systematic understanding of the efficacy of SCO interventions is required: Retailers are bringing in ‘solutions’ before we really know what works best. The data in this report point in promising directions but cannot, on their own, settle which interventions are worth the investment. The sector needs more rigorous evaluation, shared openly, including recognising the unintended consequences. Particularly the risk that interventions such as audits and age checks might on one hand reduce loss, but on the other lead to rising abuse and violence against staff. The findings in this report are a strong starting point. But there is more to do so that the most successful interventions can be shared across the industry.
- Return on investment studies relating to SCO costs and benefits are required: The true cost of SCO is still poorly understood. Robust ROI studies need to weigh loss against capital and labour savings, but also against the harder-to-quantify trade-offs: inventory inaccuracy, availability problems, reduced shop-floor presence as a deterrent, and the dual effect of SCO on both customer flow and potential offender flow into stores. Without that fuller picture, business cases for SCO will continue to rest on assumptions rather than evidence.
Introduction and aims of the research
There is some debate about the exact year self-checkout machines were introduced, though some have asserted that it was 1992. However, there is no dispute that self-checkout (SCO) systems are now a core feature of the retail environment. This report focuses on fixed SCO. This is where customers collect products from around the store and then scan and pay for the items at dedicated scanning machines. Various forms of SCO exist — including standard, belted and hybrid systems.
A core issue relating to SCO is understanding how loss is generated. Indeed, Beck (2018; 2022a) notes three principal ways SCO generates loss (see Table 1). These include:
- Non-scans: the product is not scanned at all (such as by leaving items in basket or product stacking);
- Wrong scans: a product is scanned, but is not the correct product or at the correct price point (such as through barcode switching or product switching);
- Walkaways: Customer appears to / attempts to pay for a basket or trolley, payment does not proceed and customer leaves with products that have not been paid for.
Table 1: Causes of SCO loss
| Type | Method | Description |
|---|---|---|
| Non-Scans | Missed-scans (such as skip scan) | Customer presents item to / moves products across the scan area, but the item is not scanned. |
| Items Left in Bottom of Trolley / Cart or Inside the Basket | Customer leaves items in trolley/basket and does not present them for sale/ scanning. | |
| Product Stacking | Customer places similar / similar sized items together to ‘shield’ some items from the scanner. | |
| Product Stuffing | Products are placed inside another [bigger] item to avoid scanning and detection. | |
| Scan Errors on Promoted Items | Customer does not scan the “free” item on “3 for 2” or “2 for 1” promotions. | |
| Wrong scans | Product Lookup Menu error | Where the customer mis-represents the item being presented for sale via the PLU. For example, customer presents organic peppers on the scanner but presses the button for normal peppers. |
| Multiple Variety Errors | Customer scans multiple variety types as one variety (cat food, soup, etc) to speed up scanning. | |
| Barcode / Sticker Abuse | Customer removes sticker from a lower priced item, for example, reduced to clear sticker, often without weight association and scans this cheaper bar code to pay for higher priced item. | |
| Weight-scale error | Bag of fruit placed on weigh scanner but some not on the weigh part. | |
| Walkaways | Walkaways | Customer appears to pay / triggers attempts to pay via card, but the payment does not go through (e.g., soft decline), the store only discovers non-payment issue after the customer has already left the store with the unpaid for items. |
Adapted from Beck 2018; 2022a.
Further to this, Beck (2018) notes three principal loss outcomes generated by SCO:
- Lost stock: SCO can result in stock and its value being lost. This can also have a knock-on effect on inventory accuracy.
- Lost sales: Sales are lost as store inventories can become corrupted. Store systems record products being available that have actually been taken out of the store — leading to out of stocks and resultant loss in sales as customers are unable to purchase products that are not on the shelf.
- Lost margin: SCO can result in the scanning of products at a lower value than the set price (especially for fruit and veg) resulting in a loss of profit margin on products.
Although retailers are aware SCO generates loss, robust estimates of loss to the retail sector are both rare and much of the work that exists is now dated. While a study completed with one retailer in 2015 estimated that loss through self-scan could be 170% higher than for staffed check-outs (Beck & Hopkins, 2015), the most comprehensive study completed to date was completed by Beck (2018), where it was estimated that:
- Losses generated in stores with SCO machines were 33% to 147% higher than in stores without SCO technology (based on data from four retailers).
- Stores with more SCO machines and a higher proportion of transactions going through SCO machines tend to have higher rates of shrinkage (based on data from one retailer).
- Each 1% of scan utilisation (transaction value) caused shrinkage to increase by 1 basis point (0.01%) (not accounting for other losses, such as lost margin or lost sales) (based on data from one retailer).
- Non-scanning at SCO machines accounted for 0.44% of SCO sales, but amounted to 9.5% of all store-recorded shrinkage (based on data from two retailers).
Further to this, in a survey of 93 retailers across 25 countries (that represented 13% of global sales) published in 2022, it was observed 65% of respondents consider SCO-based losses as becoming a growing problem with nearly half (47%) suggesting that SCO caused between 21-50% of all unknown store losses (Beck, 2022a).
Some customer survey research has also identified potential customer ‘frustrations’ and ‘risks’ associated with SCO (see Mullen & Nott, 2025). A survey of 1,000 SCO shoppers identified some customer frustrations with the way SCO operates, with 44.5% ‘sometimes, often or always’ experiencing age verification issues and 39.3% experiencing ‘unexpected item in bagging area’ messaging when using SCO. In terms of using SCO as camouflage for crime, 20.5% of SCO users say they ‘sometimes, often or always’ fail to scan an item on a shopping trip. A total of 24.8% also admitted to not inputting new plastics bags; 17.4% did not always correctly weigh loose items and 17.7% ‘sometimes, often or always’ incorrectly input a loose item.
The study by Beck (2018) was ground-breaking in terms of both the number of retailers participating in the study (13) and the methods used to calculate loss. However, since that study was completed, there has been rapid continuation in the implementation of SCO technology. In 2022 it was reported that 96% of grocery retail and 77% of non-grocery retail now had some form of SCO in place, with utilisation rates (sales) across many retailers higher than traditional checkout transactions (Beck, 2022a). With this rapid expansion of SCO technology and previous research pointing to substantial losses, it is surprising more systematic contemporary research estimating the extent of loss has not been completed. Therefore, the primary aims of this research are to understand:
- How retailers are currently experiencing losses associated with SCO;
- The causes of loss generated by SCO;
- What interventions are currently being used to mitigate loss and how effective they appear to be.
In order to answer these research questions, the report is structured into the following sections:
- SCO utilisation rates;
- SCO impact on loss;
- How SCO generates loss;
- The impact of SCO on overall business loss;
- The efficacy of SCO interventions;
- Conclusions and recommendations.
The project methodology is presented at Appendix A.
SCO utilisation
Despite concerns being expressed over the extent of loss generated by SCO, the evidence suggests there has been a rapid roll-out in recent years. Of the 39 retailers returning data for the current 2026 study, it was evident that, in stores where SCO is present, this is now often the preferred form of customer transaction. Below, in Table 2, data relating to the proportion of stores with SCO, the proportion of baskets that go through SCO and the proportion of SCO sales for the retailers in the sample group is presented. This illustrates, on average:
- 75% of stores had SCO, but with the range of 9 to 100% of stores;
- 54% of transactions go through SCO, with a range of 19 to 80%;
- 41% of sales in SCO stores go through SCO, a range of 7 to 80%.
Table 2: SCO coverage and utilisation of the sample cohort
| Measure | % Mean | % Range |
|---|---|---|
| Proportion of stores with SCO | 75 | 9 – 100 |
| Proportion of transactions in SCO stores that go through SCO | 54 | 19 – 80 |
| Proportion of sales in SCO stores that go through SCO | 41 | 7 – 80 |
Base: 21 retailers with SCO returning data about SCO coverage.
The data illustrate that, while the majority of transactions in many SCO stores now go through SCO, most sales will often progress through manned-checkouts. Thus, lots of smaller baskets will commonly be progressing (quickly) through SCO (with larger baskets through slower manned-checkout lanes). This has potential implications for loss. Indeed, the concept of SCO is quick/ frictionless self-service.
While self-service places trust in the customer to accurately scan and pay (Beck, 2018a), this rapid turnover of transactions might also lead to more genuine customer error and potential frustrations if progress is not as frictionless as customers might have hoped. Therefore, core questions relate to the extent loss is generated by SCO and how that loss is generated. This is considered below in sections 3 and 4.
SCO Impact on Loss
Before and after SCO studies
We present two estimates of loss — percentage difference and percentage increase. It is estimated there is an average difference of +0.26 percentage points in the first year of operation. It is also observed that SCO increases loss by an average of 22% after SCO implementation.
This is based on data from 19 ‘before/ after’ studies. These are studies where changes in shrinkage are measured for at least a year after SCO implementation. Figures 1 and 2 present the loss estimates from ‘before/ after’ studies. Here we see that:
- The estimated percentage difference in loss (Figure 1) — based on data from 11 grocery retailers (1,700 test stores) 12 months after installation — is between 0.05% and 0.58% (a mean difference of 0.26%).
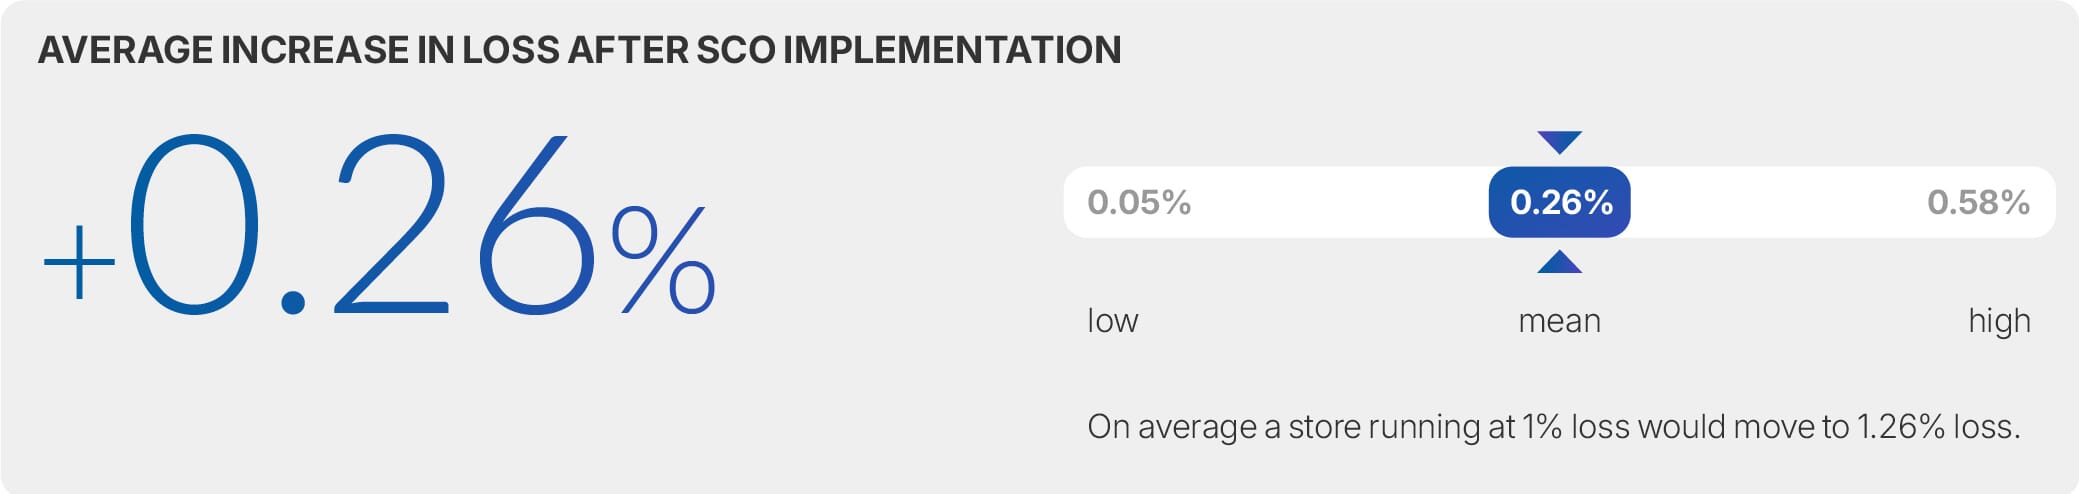
Figure 1: Before/after studies: %difference in loss after SCO implementation
- The estimated percentage increase in loss (Figure 2) — based on data from 8 grocery retailers (1,300 test stores) 12 months after installation — is between 3.19% and 41.2% (a mean increase of 22%)
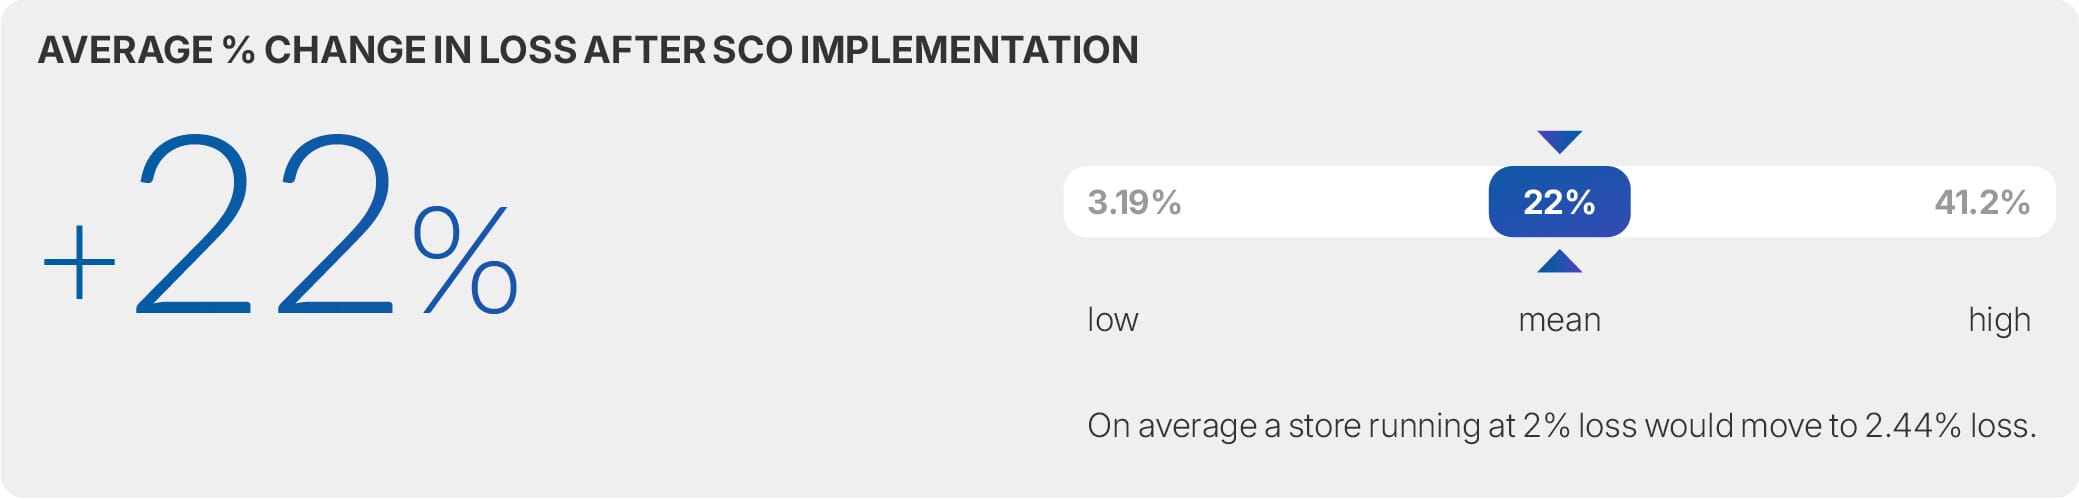
Figure 2: ‘Before/ after studies’: % change in loss after SCO implementation
With and without SCO studies
As above, we present two estimates of loss — percentage difference and percentage increase. It is estimated there is percentage difference of +0.42 percentage points between stores with SCO when compared to those without SCO. It is also observed that losses are 33% higher in stores with SCO.
Figures 3 and 4 present the loss estimates from ‘with/ without’ studies. These are studies where retailers have compared shrinkage for groups of stores (test stores) with SCO and compared to stores that do not have SCO (control stores). Here we see that:
- The estimated difference in loss (Figure 3) — based on 7 studies completed by 5 grocery retailers (2,794 test stores and 5,129 control stores) — is between 0.20% and 0.75% (a mean increase of 0.42%).
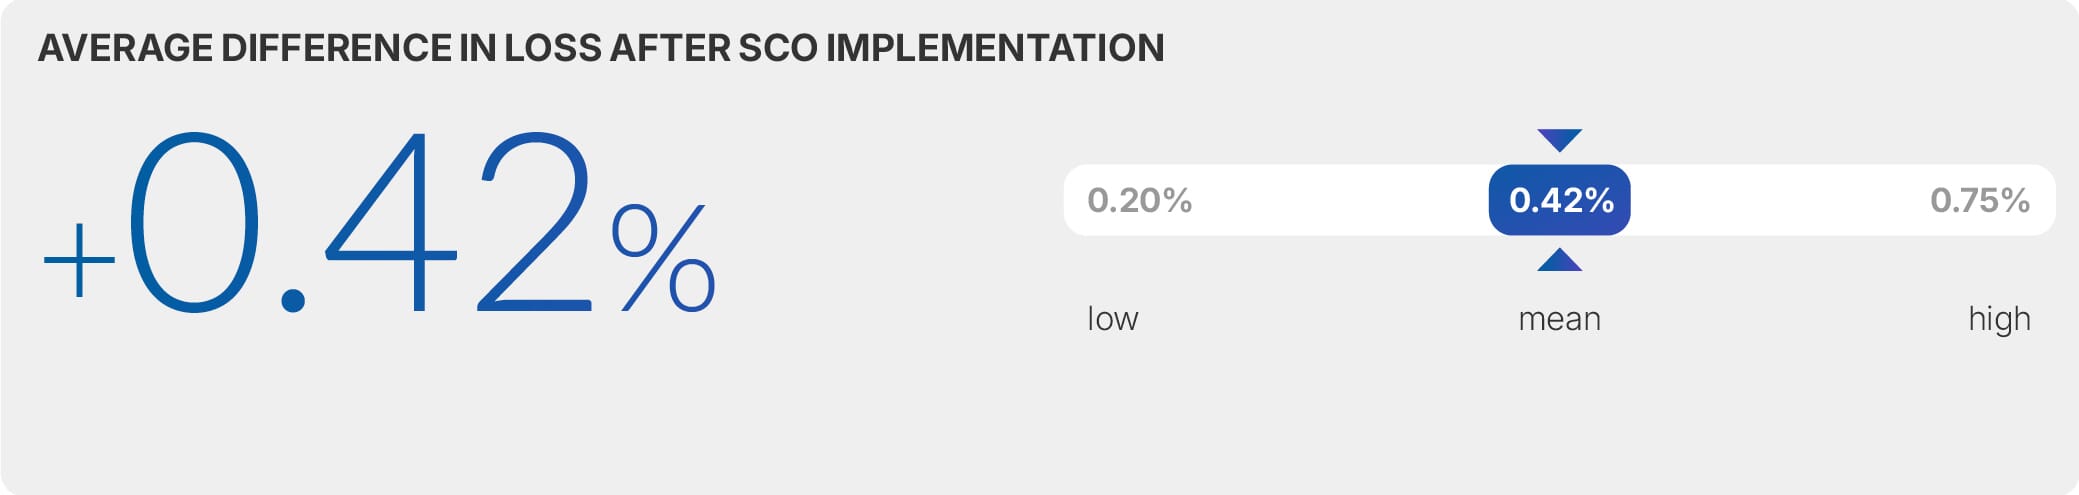
Figure 3: ‘With/ without studies’: % difference in loss after SCO implementation
- The estimated increase in loss (Figure 4) — based on data from 12 grocery retailers (5,500 test stores and 6,000 control stores) — is between 3% and 88% (a mean increase of 33%).
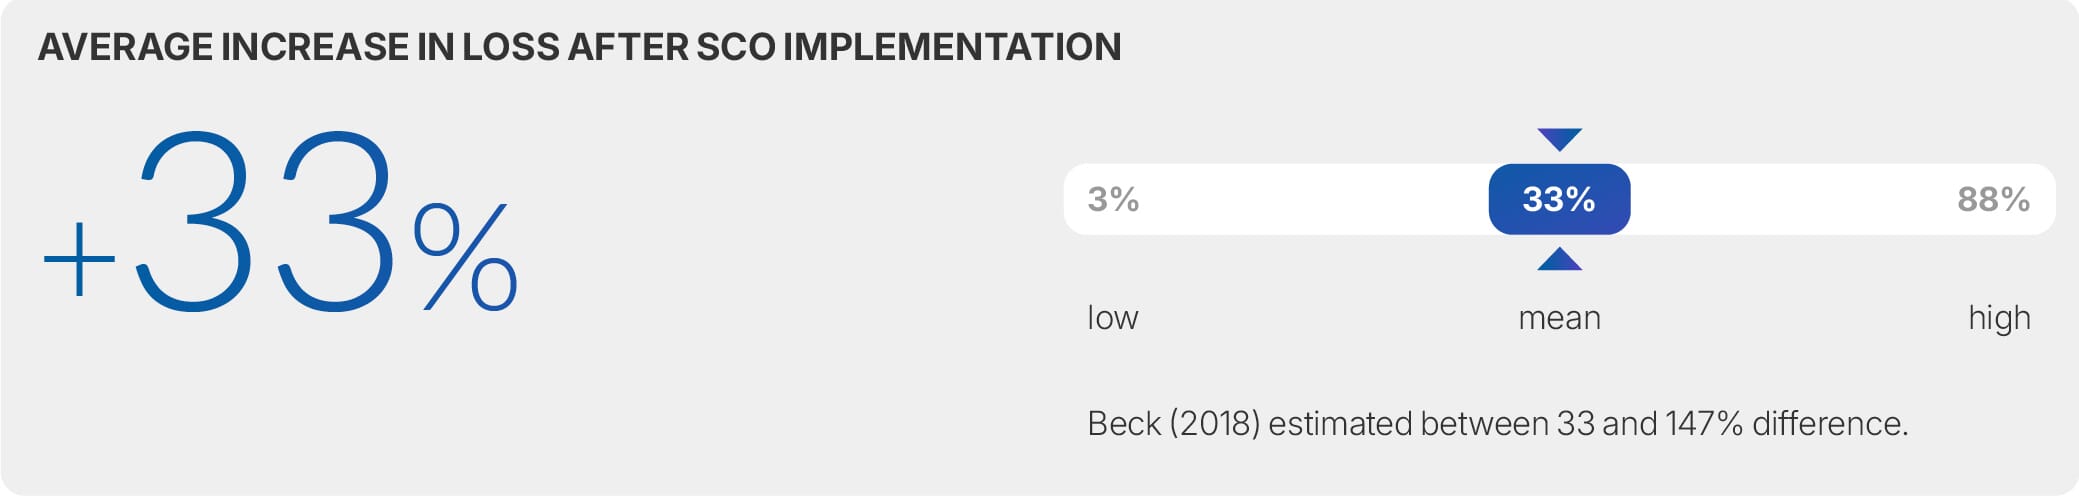
Figure 4: ‘With/ without’ studies: % change in loss after SCO implementation
The data from before/after studies record lower rates of loss increase than the with and without studies.
A reason for this is possibly due to how comparison groups are selected in these studies. If stores are not carefully matched on similar criteria, stores are following different loss trajectories before implementation or loss controls are implemented in the control store then this will impact the results.
However, when compared to the findings of Beck (2018) the extent of loss is, on average, lower.
Here, using with/without methods based on data from 4 retailers, Beck (2018) observed differences of between 33% to 147% after SCO implementation. Therefore, data from Beck (2018) and the current study point to (1) SCO leading to increased shrinkage and (2) there being wide variations in potential loss from company to company.
However, the overall rate of losses observed in the current study are lower than what Beck (2018) observed.
Potentially, this might be a result of retailers better understanding how to mitigate SCO loss (through design and interventions) or growing customer SCO literacy. The Beck study was completed over seven years ago and SCO was still a relatively new development in retail.
SCO is now a routine part of the retail environment and most shoppers who opt to use SCO for payment are familiar with the technology — this might have reduced the scale of scanning errors and genuine mistakes seen in previous studies.
How SCO generates loss
The data illustrate that SCO is a generator of additional loss. However, interviews with retailers suggest this is a simplistic view of the impact of SCO. Many commented on how SCO losses are dependent on factors such as the extent of SCO utilisation in stores, store location, store design and the types of interventions that are integrated into SCO. In the next three sections, we consider:
- The relationship between SCO utilisation and loss.
- Internal generators of SCO loss.
- External generators of SCO loss.
SCO utilisation and loss
Utilisation studies consider whether SCO utilisation — such as the number of SCO machines or transactions via SCO — has an impact on loss. In total, 18 companies reported on the effects of utilisation, with 15 supplying numeric outcome data. The key findings are presented in Table 3. The table outlines the number of companies returning data, the number of test stores, the number of control stores, the time periods of the studies, whether SCO had a positive or negative impact on loss and what the main measure of utilisation was. Overall, we see the studies related to 5,574 stores. Of the 18 retailers providing data, 15 suggested increased utilisation led to increased loss, 1 suggested there was no change and 2 were unclear.
Table 3: SCO utilisation studies measures of loss
| Number of companies returning data | Test stores | Outcome | Time periods | Utilisation measure |
|---|---|---|---|---|
| 18 (15 studies with some numeric outcome data) | 5,574 | 15 studies report an increase; 1 no change; 2 unclear. | All within last 4 years (all take snapshot at different points in time). | % Transactions through SCO |
Base: 18 retailers returning data on utilisation. All grocery.
Although 15 studies point to an increase in shrinkage as a result of increased utilisation, a more important question is: what is the extent of shrinkage increase as a result of SCO utilisation? One of the challenges with the data provided was that retailers often reported results that were not comparable with each other.
Therefore, in order to get a better understanding of the utilisation/ loss rate, detailed analysis was completed of data from four retailers that allowed for similar comparative analysis to be conducted (see Figure 5 below). These were all grocery retailers with one operating in the USA and the other three in the UK. Each retailer provided data on the percentage of SCO transactions across their stores and the shrink rates in those stores. Across the four case study retailers, the number of sampled SCO stores were 136, 195, 1,328 and 85 (the relative number of stores across the businesses were 410, 420, 2350 and 795 respectively). In Figure 5, the data from across the four retailers (1,744 SCO stores) are aggregated and indexed at 100 in order to allow for some comparison with the data from Beck (2018) (the non-aggregated data is located at Appendix B). The data show that:
- As SCO utilisation increases so does the shrinkage rate;
- The most rapid increase in loss is when utilisation is over 71%. Here, the increase in loss when utilisation moves from 61-70% to 71-80% is 30 index points. This is much higher than what is observed for the move from 41-50% to 51-60% (which is 19 index points) or 51-60% to 61-70% (which is 13 index points).
Making direct comparisons with the data analysed by Beck (2018) is difficult here as different datasets and sample sizes are being compared (and utilisation has generally increased since 2018). However, where Beck (2018) observed an increase of SCO loss of 16 index points as utilisation increased from the low 40s to high 50s; our data suggest a move in utilisation from low 40s to high 50s led to increased loss of around 19 index points — a similar rate to that observed by Beck (2018). There is however, some further research that suggests why SCO losses might increase with increased utilisation. In a survey of 6,000 SCO hosts, Beck (2022b) found that as the numbers of machines increase, SCO hosts often felt there were not enough staff to effectively monitor areas.
This both impacted on the guardianship capabilities of SCO hosts and increased the likelihood of customer frustrations — resulting in increased risk of abuse and violence against staff. SCO hosts suggested 1 host per 6 machines was optimal (data presented in section 4.3 of this report also illustrates how increased utilisation can put pressure on hosts in terms of response times to customers).
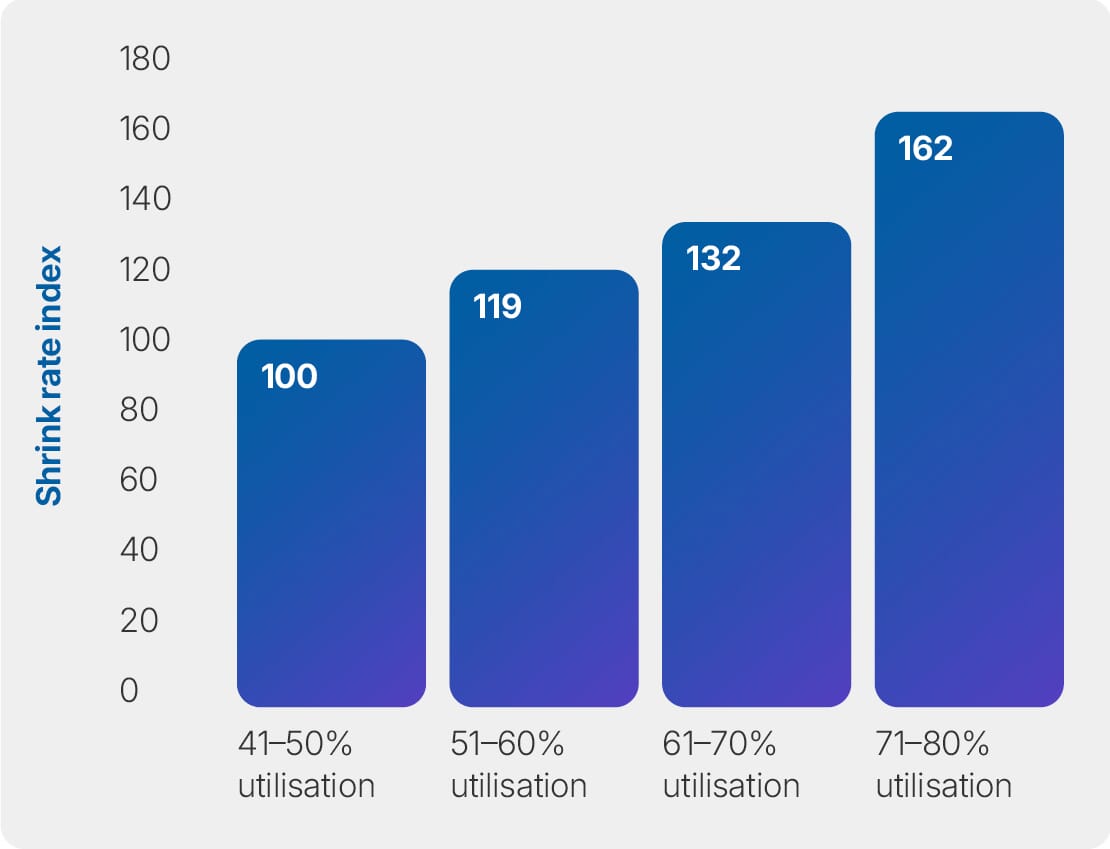
Figure 5: Relationship between SCO utilisation and rates of loss
Base: data from 4 retailers aggregated.
Data were also collected from 3 retailers that allowed us to predict the exact impact of increased SCO transactions on loss. These were all grocery, with 2 operating in the UK and one in the USA. The findings are presented as four case studies below. Case study 1 and 2 are based on data provided by the same retailer, but split into two different years (2023 and 2024). Case study 3 and 4 are based on data from different retailers. The data allowed for simple linear regression analysis to be completed that predicts the impact of increased transactions on loss (the linear regression is outlined in more detail in Appendix C).
What is of particular interest here is that the four cases studies (of which 3 are from different retailers) all show fairly similar results. This is illustrated in Table 4, where we present a summary of the findings for increases in transactions of 1%. This predicts that a 1% increase in SCO transactions will generate between 0.030 to 0.048 more shrink in a store. By comparison, Beck (2018) observed a utilisation rate increase of 0.01% for every 1% additional utilisation. While this is lower than the rate observed in 2026, some care has to be taken as to how this is interpreted. Beck used merged data from two retailers, who also appeared to have lower average utilisation rates than retailers in the 2026 (though the actual average utilisation rate is not published in the 2018 study).
Table 4: The impact of increased SCO transactions on loss
| Retailer | 1% increase in SCO sales: impact on shrink | Sample of SCO stores (utilisation rate) |
|---|---|---|
| Case study 1: Year 1 | 0.048 | 196 (56%) |
| Case study 1: Year 2 | 0.046 | 196 (56%) |
| Case study 3 | 0.030 | 144 (48%) |
| Case study 4 | 0.031 | 1715 (52%) |
Base: 4 case studies.
It is evident that greater SCO utilisation will increase loss as SCO is a loss generator — it increases the likelihood that a customer will make a genuine error (and not scan) or will use SCO as camouflage for more malicious forms of intentional non-scan behaviours. As indicated above, increased utilisation will also increase pressure on SCO hosts (if the number of hosts is not increased in line with utilisation) and lead to increased customer frustrations (also see Beck, 2022b). In informal interviews with retailers, several had views about the relationship between utilisation and loss. As one stated:
“Increased use [of SCO] will always see increased loss — you are never going to get no customer error. It stands to reason. It [is] just the extent of the loss that can be the issue.”
However, there was a commonly held view that loss tended to be higher immediately after SCO is implemented:
“We think that as soon as there are SCOs, the opportunistic thief immediately abuses them and that these customers are immediately active, which means that the % of extra loss is proportionally much higher in the beginning compared to the scanned turnover.”
Details of further loss drivers of SCO are outlined later in this report at Figure 7.
Store-based generators of SCO loss
Data were provided from 12 retailers about the frequency and costs of various non-scan behaviours including:
- Non-scans: missed scans at the scanner, items left at the bottom of the basket/ trolley and item not on file;
- Wrong scans: barcode switching and product lookup menu error;
- Walkaways: walkaway without completing payment.
The findings are presented in Figure 6, where missed scan at the scanner is identified as the most prevalent form of loss, evident in between 1% and 4.8% of transactions. This is followed by product lookup menu (PLU) error, at between 0.18% and 0.20% of transactions, and items left in the trolley or basket, at between 0.02% and 0.20% of transactions.
The PLU figure requires further explanation, as not every transaction involves a customer using the PLU menu. Retailers reported widely varying estimates of how often customers use it: some put the figure as low as 3% of transactions, others as high as 70%. We have blended responses from six retailers to arrive at a working estimate of 10%. In the data requests, retailers reported back that, where the PLU menu is used, between 1.8% and 2% of those transactions will generate loss. Applying that loss rate to the 10% of transactions in which the PLU is used produces the figure shown: i.e., approximately 0.18% to 0.20% of all transactions involve some form of PLU error.
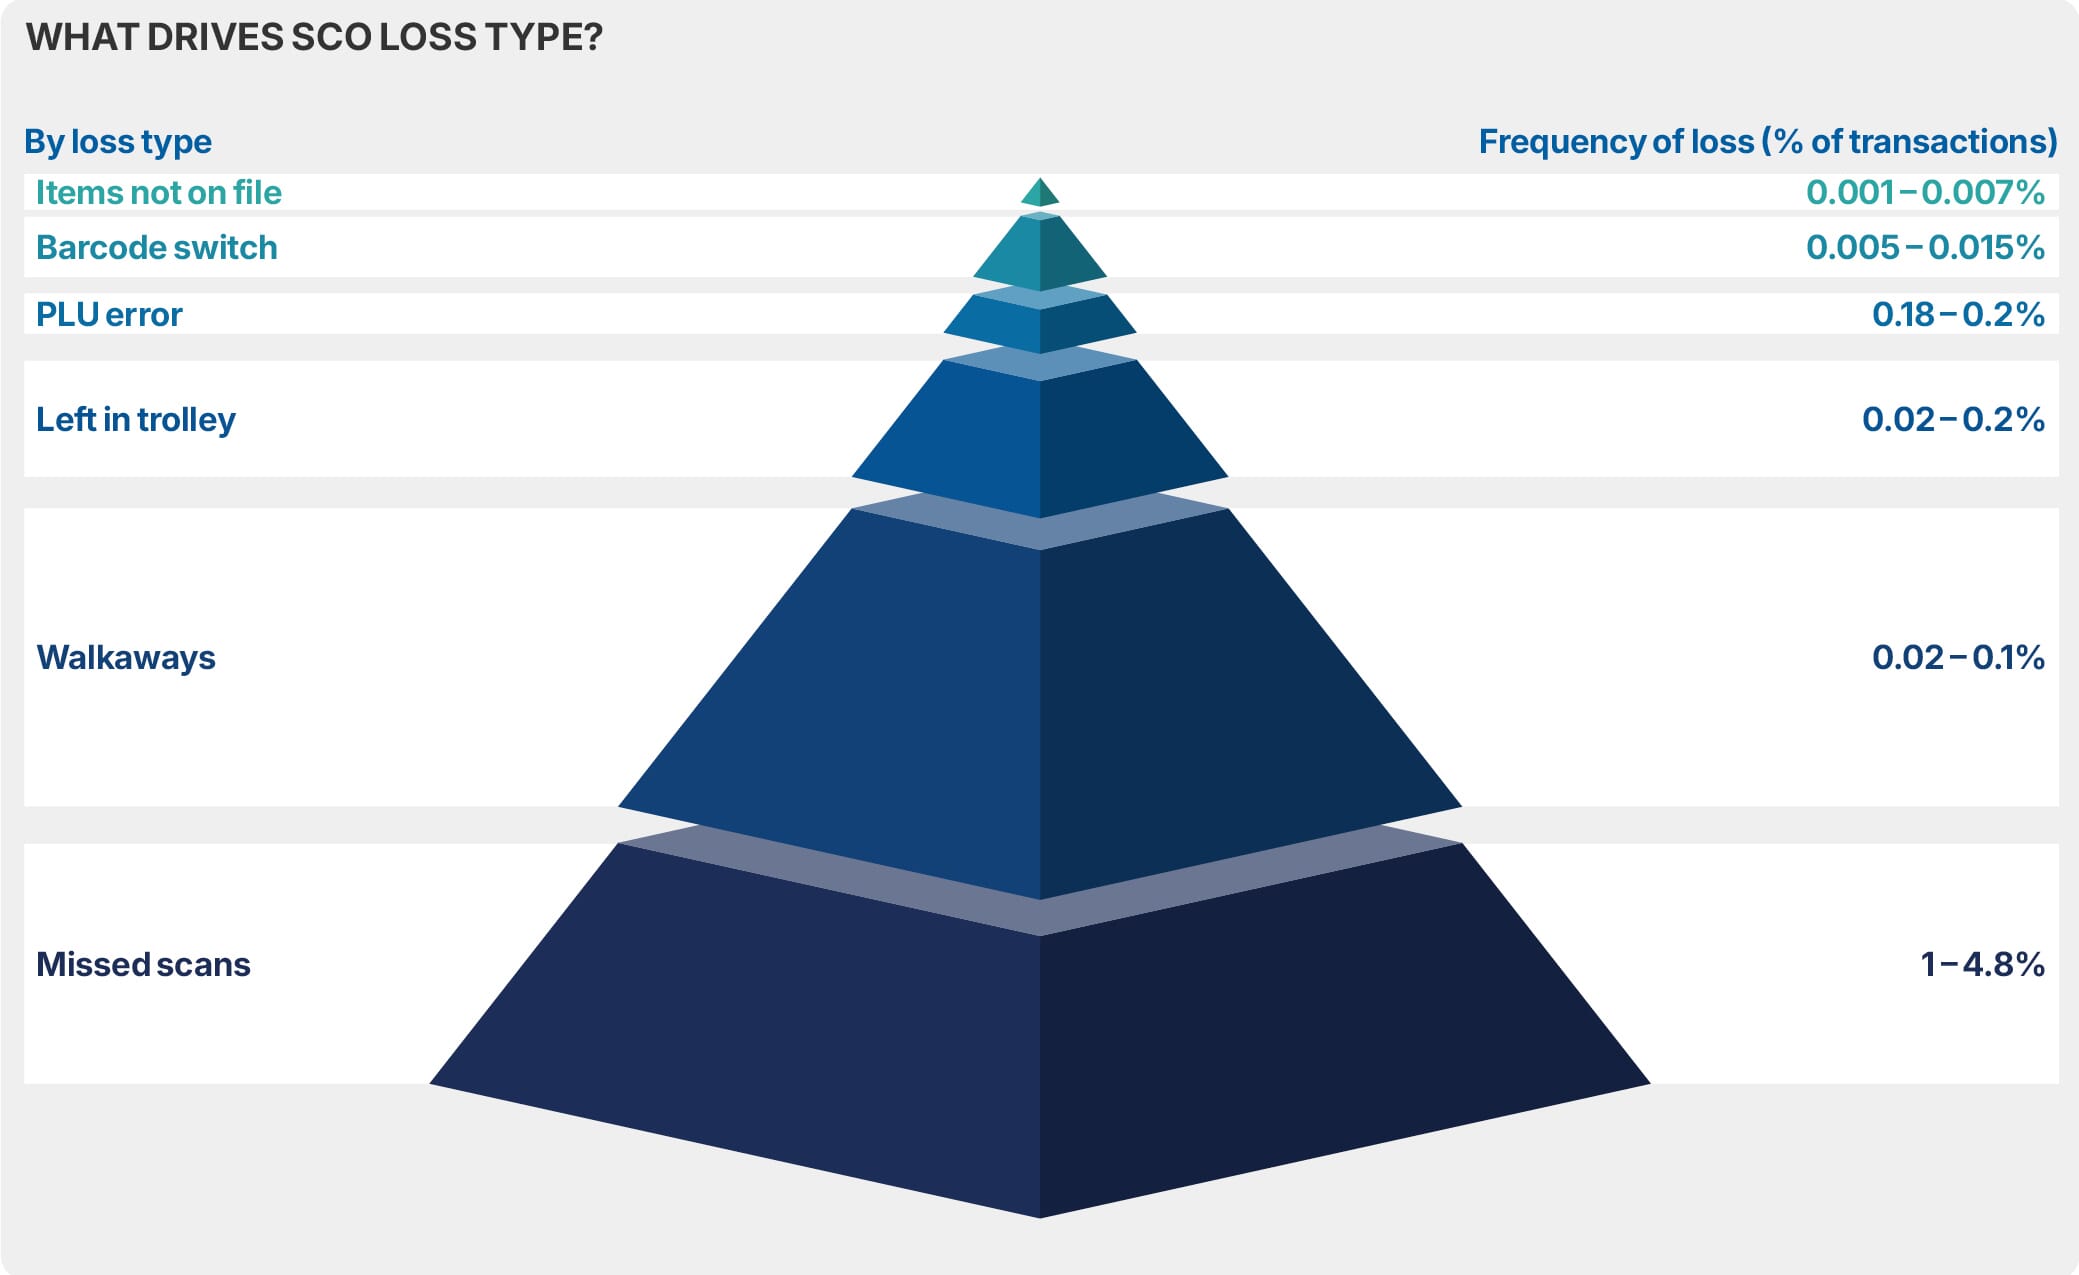
Figure 6: Frequency of loss per transaction
Base: 12 retailers.
Estimates were also provided of the average cost for each loss type. Despite being the most prevalent types of loss, product lookup error and missed scans were estimated to generate the lowest loss per incident (€1.50 and €2.50 respectively). Barcode switch and walkaways generated the highest average loss per incident (€17 and €88 respectively).
These loss data allowed for extrapolations to be made of the cost risk exposure per 1,000 transactions. This is presented in Table 5 for all loss types, with a high-risk exposure cost per 1,000 transactions presented. The high-risk exposure is calculated by taking the higher estimate of the frequency of loss outlined in Figure 6 and extrapolating to 1,000 transactions. For example, in relation to missed-scan, the higher frequency estimate is 4.8% of transactions, suggesting this occurs in 48 in 1,000 transactions. If the average cost per incident is €2.50, this would equate to €120 per every 1,000 transactions. Using this method, we are able to calculate a risk exposure which shows the highest risk exposure per 1,000 transactions to be:
- Missed scan: High risk exposure of €120 (48 per 1,000 * €2.50);
- Walkaways: High risk exposure of €88 (1 per 1,000 * €88);
- Left in trolley: High risk exposure of €16.00 (2 per 1,000 * €8).
Table 5: Value of loss (by loss type)
| Type, Loss | Average value per transaction | High risk frequency rate per 1,000 transactions | High risk cost exposure per 1,000 transactions |
|---|---|---|---|
| Missed-scans | €2.50 | 48 | €120 |
| Walkaways | €88 | 1 | €88 |
| Left in trolley | €8 | 2 | €16 |
| PLU error | €1.50 | 2 | €3 |
| Barcode switch | €17 | 0.15 | €2.55 |
| Item not on file | €5 | 0.007 | €0.34 |
A key question is the proportion of non-scan that is genuine customer error compared to what might be considered malicious, where the customer clearly intends not to scan. Previous research suggests estimates can produce wide ranges. For example, in a survey of 93 retailers, Beck (2022a) found that 32% of respondents thought 0-25% of SCO loss was malicious, with 10% stating that 76-100% of SCO losses were malicious. The average rates for malicious losses at SCO was stated to be 48%.
In the current research, 9 grocery companies made some estimate of the proportion of non-scan events they considered to be malicious. Of course, identifying customer behaviour that is ‘malicious’ is challenging. With this in mind, often retailers would aim to establish ‘intent’ through analysis of behaviours that indicate intentional non-scanning. For example, when customers indicate a scanning motion, but do not scan products; or if, when challenged, there is an unwillingness to have products rescanned or aggressive behaviour towards staff. One respondent noted that if there were more than 3 incorrect items in a basket or a difference in over €10 between scanned value and actual basket value, this would be considered malicious, rather than genuine error. Indeed, the difficulties in identifying customers’ intent might be somewhat reflected in the data here, as there are large variations in estimates of malicious non-scan. This is outlined in Table 6 where high and low estimates of malicious non-scan are considered by whether the estimates were made through video analytics or other methods.
Table 6: Estimates of malicious behaviours as a % of non-scan events by method of identification
| Method of Identification | High estimate | Low estimate |
|---|---|---|
| Video Analytics (n=4) | 63% | 6% |
| Other (n=7) | 80% | 33% |
Base: estimates from 11 retailers (9 grocery).
A further indication of intentional malicious behaviour comes from ‘nudges’ data.
Nudges typically take the form of messages that encourage customers to correct behaviours in some way (i.e., a message appearing on the screen such as ‘have you forgotten to scan the last item?’). A nudge would typically be triggered for a missed scan or item seen by the computer vision ID technology but not presented for payment. Data from two retailers (one USA and one UK) and two vendors suggest that between 3-10% of SCO transactions generate a nudge/ alert.
Therefore, for every 1,000 transactions, 30-100 customers would require a nudge as they did not scan an item correctly. The data also show that, on average, a customer presented with a “soft nudge”, often with a short circa 5 second video of the item that did not scan being shown on the monitor, will then self-correct in 80 to 97% of cases, with a further intervention (a “hard stop”) being required in the other 3-20%. This suggests in 30-100 out of every 1,000 transactions a customer ‘might’ be acting maliciously, but the majority are soon pulled back by a soft nudge.
As with the estimates provided in Table 6 (above) estimates of the frequency of transactions where there is malicious intent produce wide variations. There is, however, some evidence from one USA grocer who provided data on the top re-scan items, that some products do pose challenges for customers and thus could be an indicator of genuine customer error.
This product re-scan data is presented in Table 7 where the top re-scan items after a customer has been ‘nudged’ are presented and the potential reasons why customers commonly fail to scan these products. This suggests a better indication of malicious intent is where customers fail to scan known ‘easy to scan items’ and then still fail to respond to a nudge. None of these items can be considered to be easy to scan for the reasons mentioned.
Table 7: Most common re-scanned items after a customer nudge
| Product | Customer Scanning Challenges |
|---|---|
| Oranges | Finding barcode/ tag with barcode |
| Water | Heavy to lift to present barcode |
| QTIPs (cotton wool buds) | Small barcode not easy to find or read |
| Tortillas | Large and bulky item |
| Salad Bags | Barcode needs to be flattened to read |
| Bagged vegetables | Barcode needs to be flattened to read |
| Paper Towels | Large and bulky item |
| Milk | Water/ ice blocking barcode read |
| Ground Beef | Water/ ice blocking barcode read |
Overall, the data show estimates of the frequency of malicious customer behaviours vary widely. The major reason for this is because identifying customer ‘intent’ (essentially what somebody is thinking within a split second) presents significant challenges. It is evident that malicious intent is likely to vary from retailer-to-retailer (as there are different types of SCO systems in place, which create differing levels of customer opportunity) and from store-to-store (due to the malicious intent of the local customer population). While continuing to develop methods to estimate frequency of malicious behaviours is a worthy exercise, the level of inaccuracy suggests that preventative efforts need to focus on both malicious and non-malicious driven non-scan (we analyse the efficacy of preventative interventions later in this report) with non-malicious behaviours the priority.
Other forms of loss drivers
While the data illustrate how SCO generates loss, one European grocery retailer operating through 324 stores (with 241 SCO stores) was able to provide some further insight to other impacts of SCO utilisation in their stores. These ‘other’ impacts included:
- card payment issues in store;
- number of walkaways;
- help calls to staff;
- staff reaction times.
This retailer provided data in relation to these impacts from 241 of its SCO stores and 5.7m transactions for a month in 2025. We were able to analyse the impact of (1) the number of SCO transactions and (2) number of SCO tills on the variables outlined above. Initial analysis established there were statistically significant relationships (using Pearson’s correlation coefficient) between these variables and the number of SCO transactions. Therefore, simple linear regression was run to establish the impact of the number of SCO transactions. Figure 7 outlines the impact and illustrates that for every 10,000 additional SCO transactions there are:
- 100 additional card payment issues;
- 90 additional walkaways;
- 1,000 additional help calls to staff;
- Staff reaction times are (on average) 2.27 seconds slower (due to increased workload).
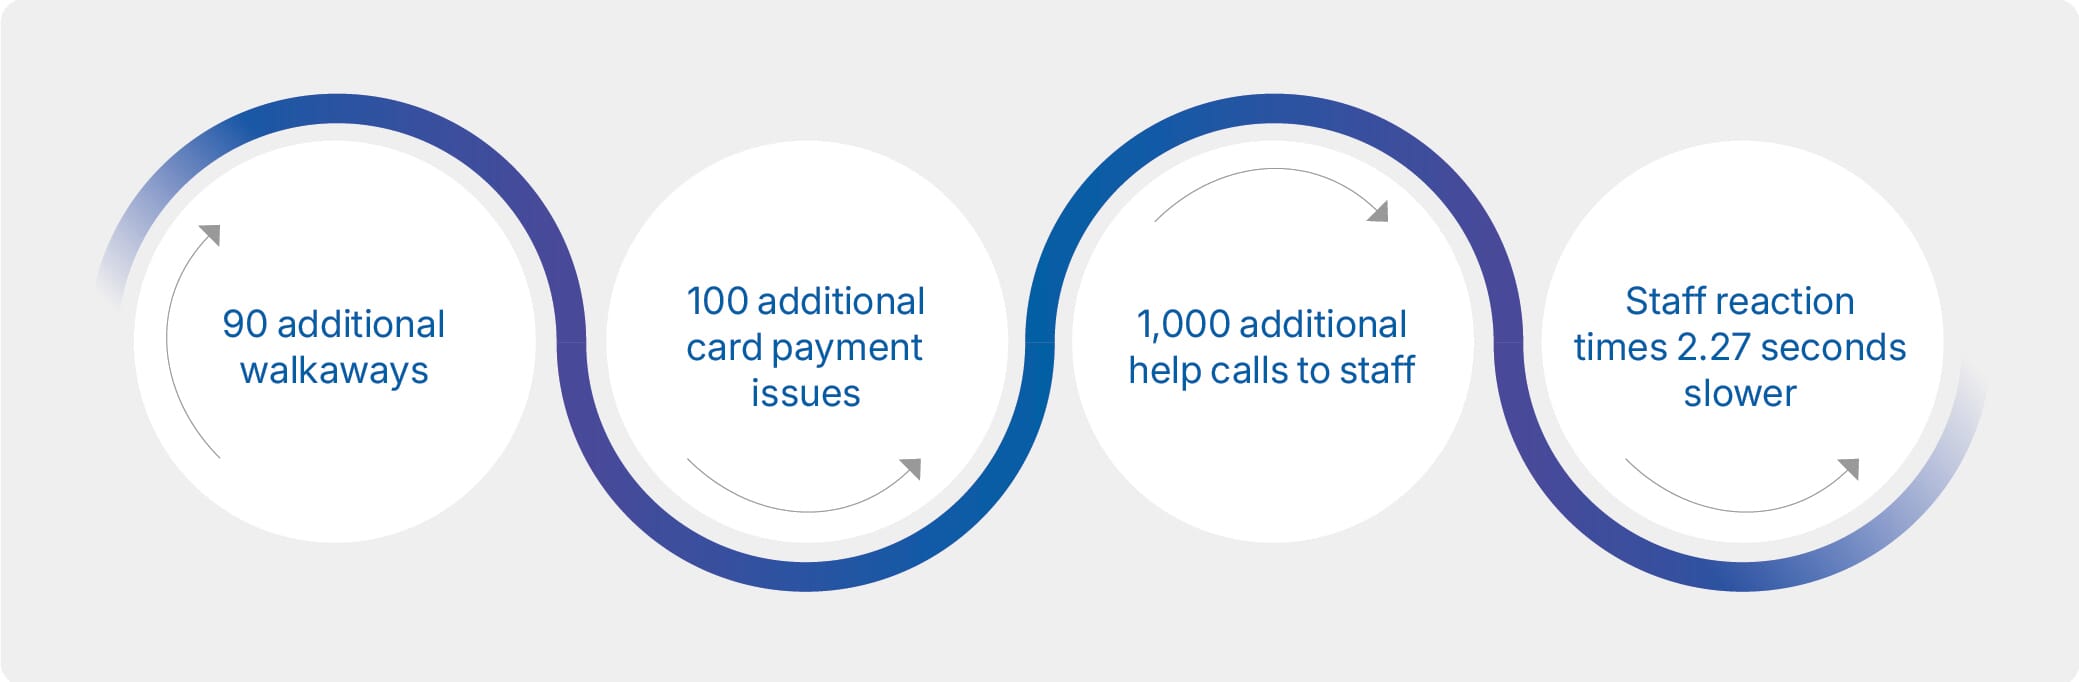
Figure 7: Additional Loss Drivers of SCO
Analysis based on 5,739,928 transactions, 1,500 fixed SCO tills across 241 stores.
There was further anecdotal data that increased SCO utilisation can have an impact on in-store inventory and on-shelf availability. Although there was little quantitative data available here, several retailers reported this:
“Yes, [in our business] higher SCO use is associated with lower stock availability, higher nil picks.
…customers consciously and unconsciously make mistakes with scanning products (for example white and whole wheat rolls with the same price), so there were slight deviations in stocks of items (over and understock) which caused the availability to deteriorate in the first months after installation of SCO.
There is correlation between stock adjustments and SCO usage… with average SCO usage over 50% resulting in book stock adjustments over the last 12 weeks of 0.55% higher (2.37% vs 1.82%).”
External generators of SCO loss
In addition to store-based loss drivers, there are also ‘external’ loss drivers for SCO. These were identified through analysis of data from two grocery retailers. One USA grocery retailer provided some data from 2,528 stores that identified how store risk factors, especially store crime risk rating, impacted on store losses and SCO losses. Further to this, one UK retailer was able to provide data on a range of factors across 2,304 stores that impact on SCO loss. These factors included store location, crime risk factors and the characteristics of the store customer base.
Both datasets showed that being a ‘SCO store’ meant a store was more likely to have above median levels of shrinkage when compared to all stores. However, the data also allowed for logistic regression models to be run that were able to test for statistical significance of a number of explanatory variables on the likelihood of a SCO store being ‘high shrinkage’, here being coded as stores with a shrinkage level above the median point. The core findings are presented in Figure 8 where it is observed that four main external/ locational factors have a statistically significant relationship with high SCO loss stores (the full workings of the models/ data output are presented at Appendix D). These include:
- Being in a high risk/ crime location;
- Being in a high population density location;
- Having a large customer base of young singles with a higher-than-average disposable income;
- Having a large customer base of people aged over 60 reduces risk.
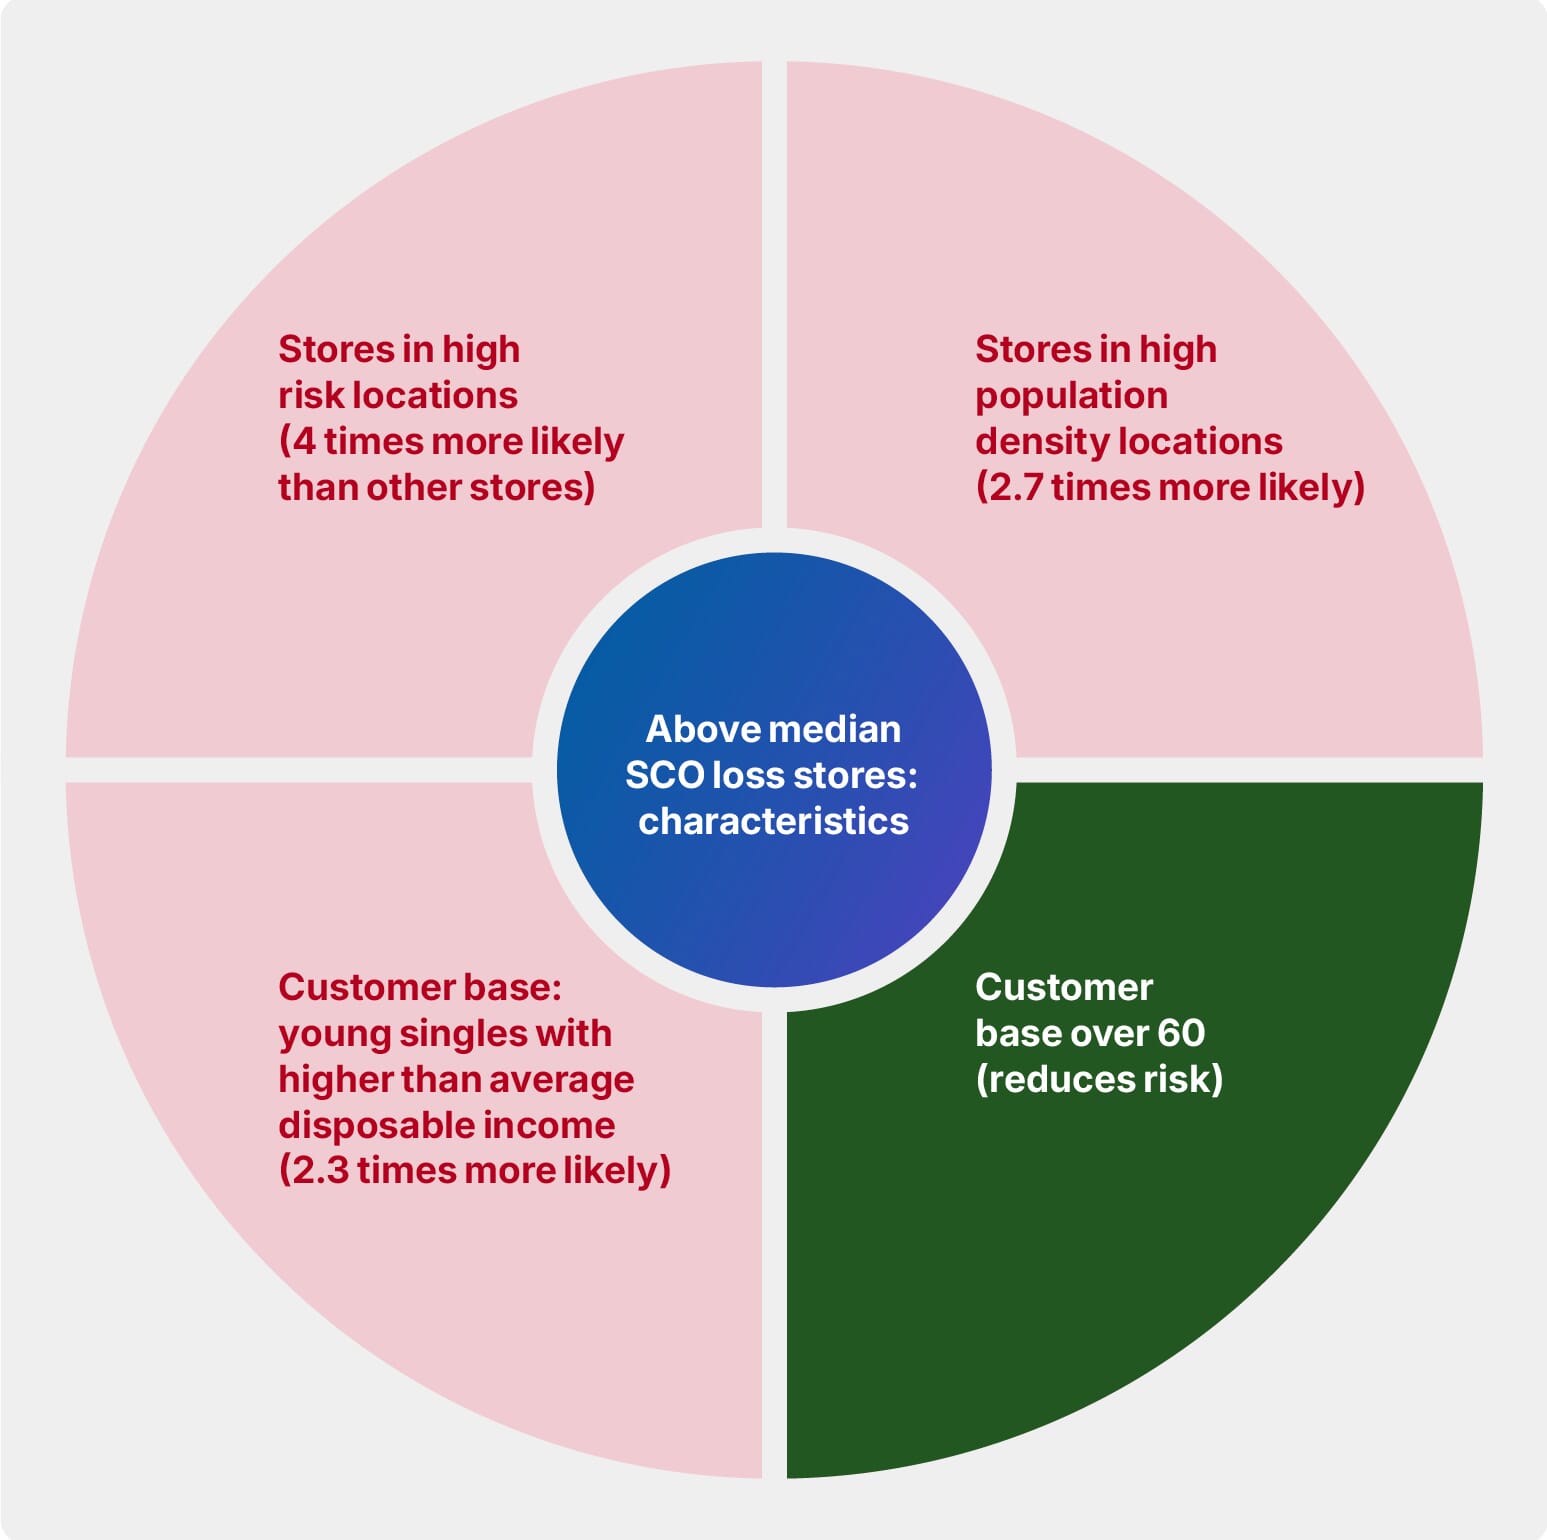
Figure 8: External/locational drivers of SCO loss
The impact of SCO on overall business loss
A further question is what do these losses mean in relation to overall sales and loss across retailers? Beck (2018) estimated SCO loss as a % of all SCO sales, SCO loss as % of total shrink and SCO loss as % of all sales by making extrapolations from two retailers with sales of €72 billion. By way of illustration, we attempt to compare the estimates made by Beck (2018) to what might be happening across the wider business loss picture in 2026. In Table 8, we compare the 2018 estimates of loss to data from one grocery retailer where comparable data were available. This is based on sales from a six-month period equating to €13.9 billion (2024). In 2018 the average utilisation rate across the grocers Beck observed was 27%. In the contemporary example it was 47%. The data show that:
- In the 2018 estimate SCO loss as a % of SCO sales was 0.44%, this was 0.46% in the 2024 estimate;
- In the 2018 estimate, SCO loss was under 0.12% of sales; this was 0.28% in the 2024 estimate;
- In the 2018 estimate, SCO loss was under 10% of all loss; this was 28.53% in the 2024 estimate.
The data need to be treated with caution as they are drawn from different retailers over different time periods. However, it suggests in 2024, SCO loss is becoming more significant to the whole business. The proportion of SCO loss as a percentage of SCO sales is similar in 2018 and 2024 (0.44% and 0.46%); but SCO loss as a proportion of sales and SCO loss as a proportion of loss has increased.
The data suggest there is an ‘increased’ utilisation effect here. In the case study retailer, the utilisation rate was higher than that in the Beck (2018) study, the effect of which is to increase SCO loss as a proportion of all sales and loss. Therefore, it indicates a retailer with a bank of six SCO machines would not be suffering more loss as a proportion of SCO sales now than in 2018. However, the second indicators, ‘loss as % of sales’ and ‘loss as % of all loss’ are wider business measures and reflect the increasing impact SCO might be having across the business. Thus, as the proportion of SCO sales has increased, the greater the impact of SCO loss on overall sales and loss figures.
Table 8: SCO loss estimates as % SCO sales, % of all sales and % all loss
| Measure | Beck (2018) | 2024 estimate |
|---|---|---|
| Average utilisation rate | 27% | 47% |
| SCO loss as % SCO sales | 0.44 | 0.46 |
| SCO loss as % sales | 0.12 | 0.28 |
| SCO loss as % all loss | 9.4 | 28.5 |
Base: data extrapolation €13.9 billion of sales in 2024.
This finding indicates a continuing long-term trend that is likely to impact many retailers. As shown earlier in this report, SCO utilisation has increased. Beck (2022a) observed that SCO accounted for as much as 23% of total unknown store losses and two-thirds of respondents in that study were of the view that SCO-related losses were becoming more of a problem in their businesses. The data presented in Table 8 suggest that the impact of SCO on business loss continues to increase. These findings are significant as it tells us that control measures designed to reduce SCO loss are now more important than ever. It is to these we now turn.
The efficacy of SCO interventions
While the data establishes that SCO generates losses, further analysis was completed to try and identify what interventions retailers are implementing to try and prevent loss; and the efficacy of those interventions.
One of the core questions around loss prevention is identifying where appropriate interventions can target loss generating behaviours. We visualise this in Figure 9, where potential ‘SCO loss prevention’ points are identified. First, Figure 9 illustrates how SCO loss might be generated. This identifies a ‘sliding scale of intent’ where customer motivations can vary from malicious forms of behaviour (highlighted in red), to those driven by frustrations (in amber) and then genuine customer errors (in green). In more detail it is suggested losses are largely generated due to:
- The ease of non-scan: it is often easy to not scan products unintentionally or to imagine an excuse to allow you to get away with it;
- Low risk perception: customers have the perception that they will not be stopped/ caught if they do not scan items. If caught, there is likely to be the perception that it will be difficult for the retailer to prove intent and the retailer is unlikely to pursue any formal legal action;
- Perceived rewards: the potential rewards are obvious, an average walkaway is worth €88 to a customer;
- Customer frustrations: customers feel, when the process does not work properly, they have the right to non-scan items. This also falls against a background of much negative publicity around SCO, which reinforces customer techniques of neutralisation, rationalisations that justify non-scan behaviours (for example, ‘I am doing all the work myself, so I have the right to take a few items’; ‘retailers save money by sacking staff’ etc) (See Beck & Hopkins, 2017; Taylor, 2016; Beck, 2011);
- Genuine customer error: many customers will make genuine mistakes. The evidence presented in this report suggests some products may be difficult to scan (see Table 7 earlier in the report).
In order to mitigate against these motivations and subsequent behaviours there are a number of actions retailers can take. Some previous research has considered how SCO design and human-centred design could generate a more frictionless customer experience and improve scan accuracy. For example, Allen et al (2024) note how streamlining/ improving the efficiency of staff intervention could reduce customer frustrations. Doruff et al (2020) also applied situational crime prevention theory to develop typologies of interventions that could potentially be used to reduce intentional theft, limit customer frustrations and correct genuine customer error. This outlined how customer provocations could be reduced by placing more hosts in SCO areas; risk perception increased by using public view monitors; rewards of non-scanning reduced by limiting/ stopping high value items being checked-out through SCO, and effort increased by target hardening products to ensure barcodes cannot be taken off/ switched on products.
This previous research has been used to help us identify the types of interventions that could be used to limit SCO loss. This primarily includes increasing the perception of risk and control in SCO areas through (1) increasing surveillance and control and (2) improving the architecture of SCO. Increasing surveillance and control involves implementing interventions that can be designed-in (exit gates), technology based (such as AI tills) or people-based measures (increasing the number of SCO hosts) to amplify risk for customers and produce a sense of control. Improving the architecture of SCO can involve actions that create a more frictionless customer journey to reduce customer frustrations.
It should be noted, a key limitation of previous studies about SCO interventions (see Allen et al, 2024; Doruff et al 2020) is that they have tended to hypothesise how their design lead interventions might work, but they do not begin to assess the potential efficacy of the interventions they identify. We attempt to take some steps towards measuring efficacy below.
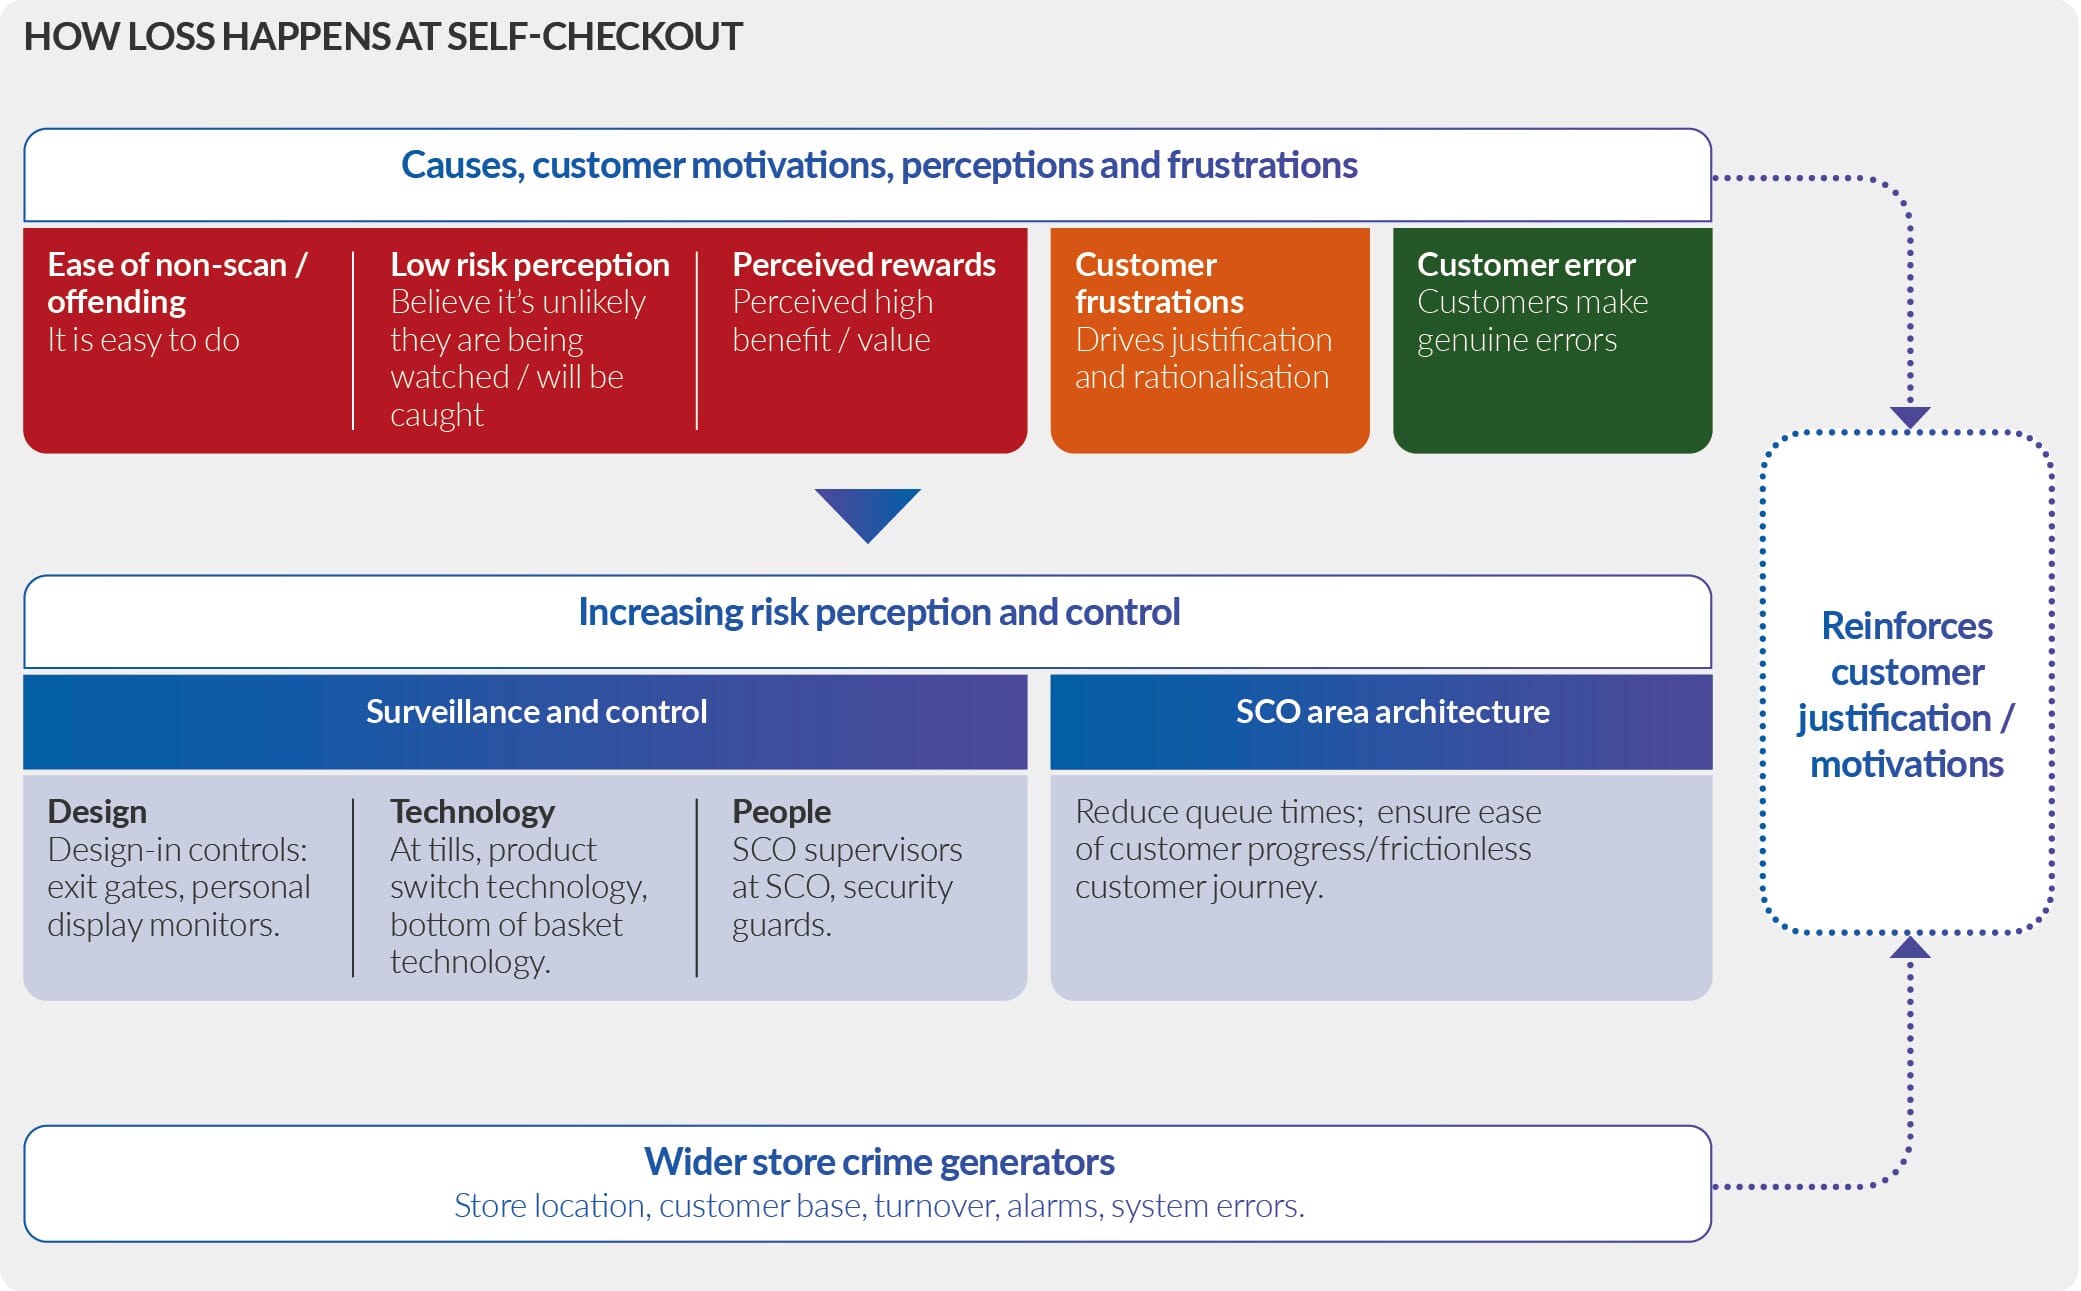
Figure 9: How loss happens at self-checkout
Retailers are currently taking several steps to increase the sense of surveillance and control at SCO points. When customers proceed through the SCO process, there are potentially a number of ‘nudges’ and ‘interventions’ that can be used to reduce the likelihood of loss occurring. As noted earlier, nudges typically take the form of messages that encourage customers to correct behaviours in some way (i.e., a message appearing on the screen such as ‘have you forgotten to scan the last item?’). There are various ways that the need to ‘nudge’ can be triggered, via weight controls, through product non-scan identification technology, product recognition technology etc. Data from two retailers suggest that customers self-correct after a nudge in 80 to 97% of cases.
In addition to ‘nudges’ there are also a variety of interventions that can be implemented to try and prevent SCO loss. For the purpose of this study, we asked about 15 different types of interventions that they (a) might have implemented and (b) about the efficacy of these interventions. These interventions could broadly be grouped into:
- Design interventions: changes to architecture/ design of SCO area or SCO payment process to (a) reduce likelihood of non-scan or (b) increase risk/effort of non-payment for items;
- Technology interventions: utilising technology, such as computer vision, to (a) identify and (b) reduce the likelihood of non-scan;
- People interventions: using SCO hosts or security guards to increase guardianship in SCO areas in order to reduce likelihood of non-scan.
Design-based interventions
In Table 9, we present evidence of impact in relation to design-based interventions. This presents the intended impact of the intervention, the number of retailers testing the intervention and whether there is any evidence of impact (a full overview of the data returns can be found in Appendix E).
Table 9: Evidence of impact (design-based interventions)
| Intervention | Intended impact | Number of retailers testing | Evidence of impact on non-scan/ loss |
|---|---|---|---|
| Introducing exit gates/ with or without receipts | Increase effort by denying exit from store unless payment made | 17 | 7 with data suggesting reduced loss/ 1 mixed findings/ 9 no data or too early to tell |
| Adding personal customer display monitors | Increase customer monitoring/ risk amplification | 11 | 5 with data suggesting reduced loss/ 2 mixed findings/ 4 no data or too early to tell |
| Limiting the number of items that go through SCO (10 items only/ baskets only etc) | Reduce potential rewards of non-scan/ number of non-scans | 7 | 2 with data suggesting reduced loss/ 2 mixed findings/ 3 no data or too early to tell |
| Turning off weight controls | Reduce customer friction and potential customer frustrations | 6 | 5 with data suggesting increased loss / 1 no data or too early to tell |
| Changing weight controls, alert at the end, alert after the second scan Vs weight mismatch, etc | Increase likelihood of detecting non-scan/ wrong scan | 6 | 6 no data or too early to tell |
| Closing off SCO at busy times | Reduce likelihood of non-scan | 6 | 1 suggests positive impact (but no data)/ 5 no data or too early to tell |
| Improving product look-up menu (simpler pricing/ clearer images/ smaller product menu) | Reduce likelihood of wrong scan | 3 | 3 no data or too early to tell |
Base: 56 interventions.
While the data here need to be treated with caution due to the low number of evaluation studies, there were some positive outcome indicators. Two interventions, introducing exit gates and personal customer display monitors, are the design-based interventions that show the most promise in reducing SCO driven losses. There is strong evidence that turning off weight controls increases loss. Indeed, five out of six studies show that turning off weight controls increases shrinkage.
In relation to efficacy of these interventions, the data suggest:
- Introducing exit gates: Of the seven studies reporting positive results, several found that exit gates reduced shrinkage. One retailer reported an improvement of 30-40 basis points in store loss over 12 months. Reported benefits also included a 30% reduction in cancelled receipts, average inventory adjustment improvements of $4.3k per week, and a 28% reduction in walkaways. However, exit gates require significant upfront investment and careful management, and they may also increase the risk of abuse and violence toward staff.
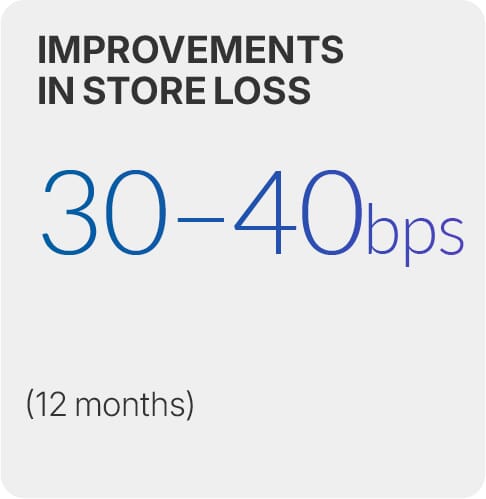

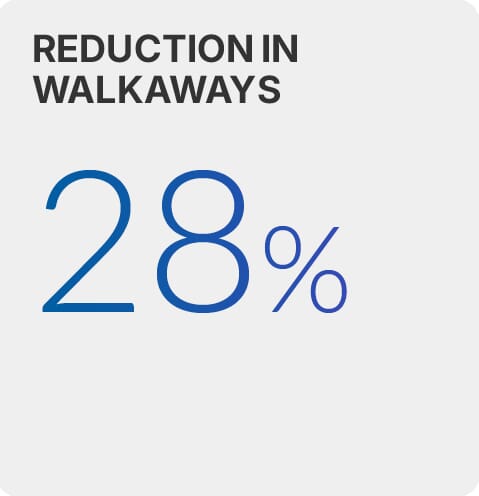
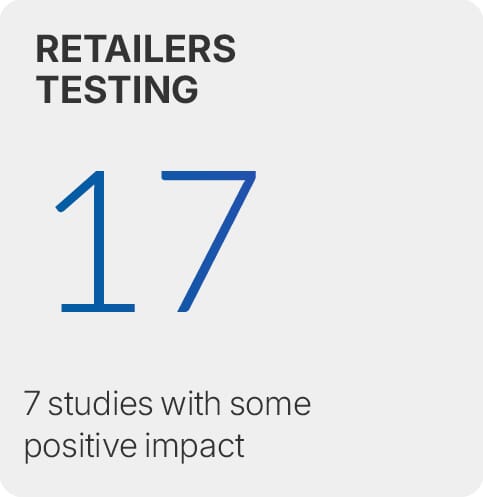
Figure 10: Design – Exit Gates
- Personal display monitors: for the 5 companies reporting positive findings, shrink improved by up to 12%. However, one retailer did report in their tests of public display monitors they often see an immediate impact, but this is not sustained when customers realise the video is not recording.
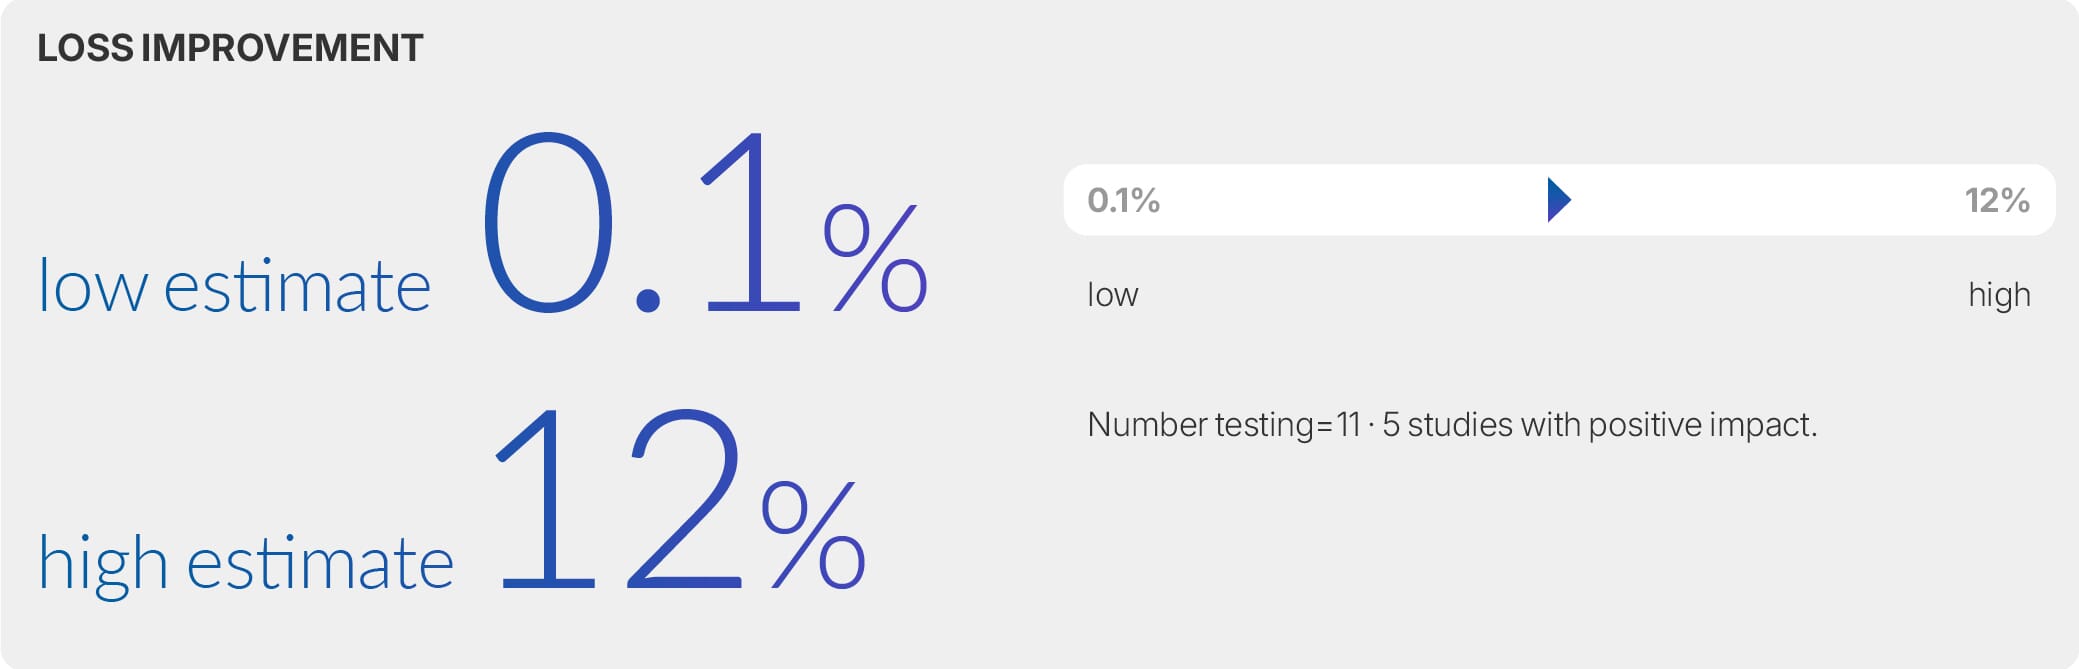
Figure 11 Design – Personal Display Monitors
- Turning off weight controls: for the 6 companies testing ‘turning off’ weight controls, 5 reported increased loss. One retailer reported that turning off weight controls led to a 20% increase in base shrink level. Others reported 0.8%, 1%, 2.5% and 5% increases. It is evident here that actions taken to try and reduce customer frustrations (as weight controls invariably slow down the customer journey) have led to increased loss.
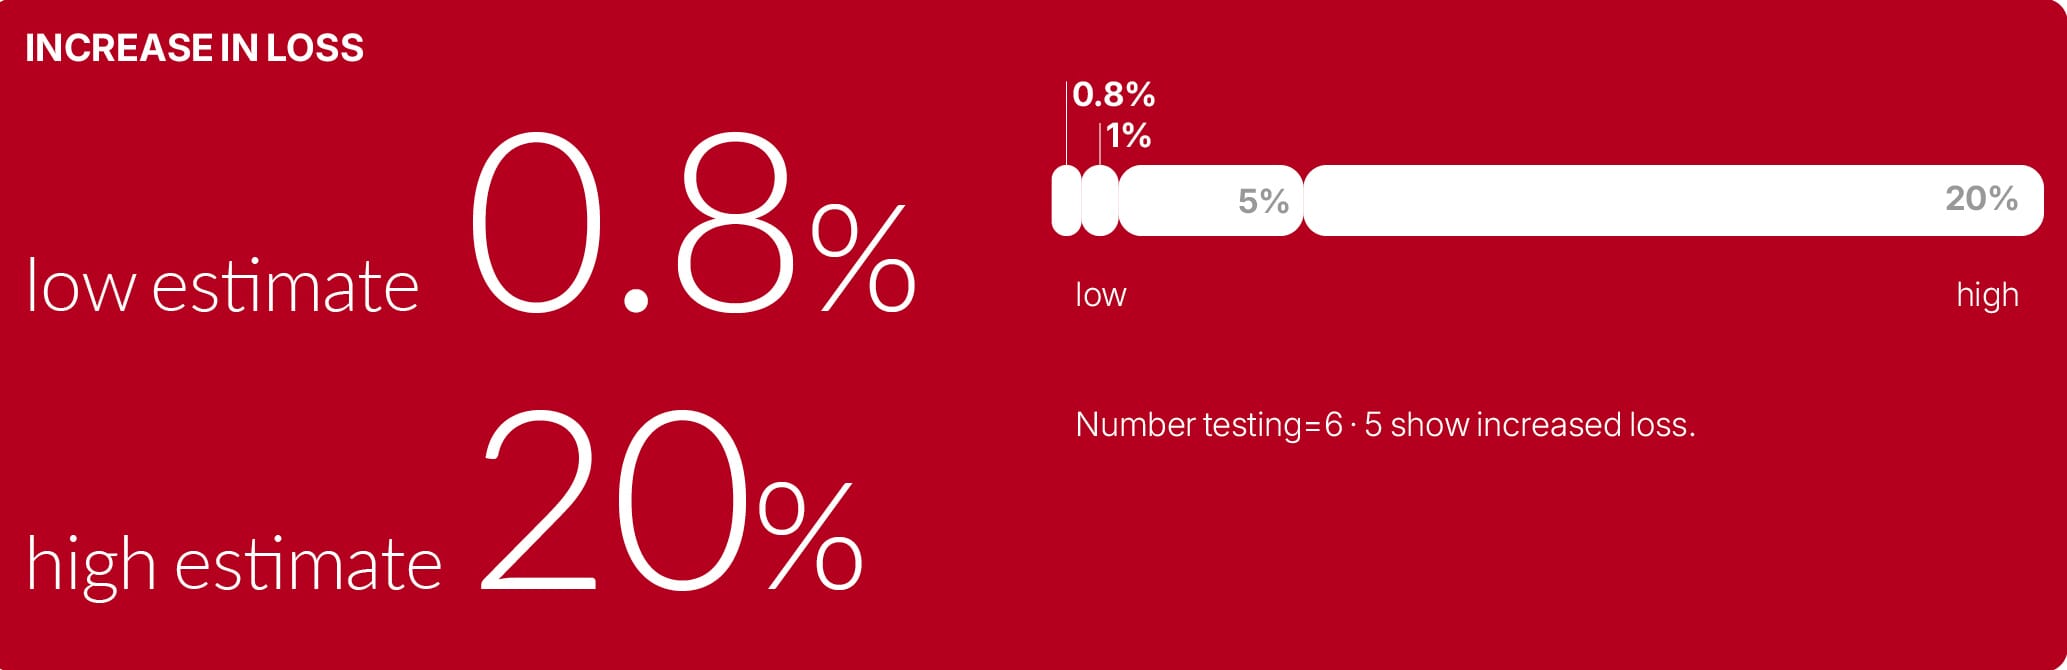
Figure 12: Design – Turning off weight controls
The data in relation to other design-based interventions had mixed findings:
- Limiting the number of items (it is worth noting there have been calls in New York to impose restrictions on SCO, including increasing staffing ratios and limiting items that can be checked out to 15: Moraine, 2026): data here were limited. However, positive outcomes include a reduction in the number of mis-scans (one retailer reported a 3% reduction). However, one retailer did caution that limiting items can be problematic as customers often do not follow the rules.
- Varying weight controls: there was little evidence that varying weight controls had an impact on reducing shrink.
- Closing off machines at busy times: one retailer reported a reduction in shrink (actual number not stated).
- Improving the customer product look up menu: there was no evidence of impact here.
Technology-based interventions
In Table 10, we move on to technology-based interventions. This presents the intended impact of the intervention, the number of retailers testing the intervention and whether there is any evidence of impact.
Table 10: Evidence of impact (technology-based interventions) identify non-scan / increase risk
| Intervention | Intended impact | Number of retailers testing | Evidence of impact/ loss |
|---|---|---|---|
| Introducing product non-scan identification | Increase likelihood of detecting non-scan/ wrong scan | 14 | 7 with data suggesting reduced loss/ 3 mixed findings/ 4 no data or too early to tell |
| Introducing bottom of basket recognition/ technology | Increase likelihood of detecting non-scan | 7 | 1 with data suggesting reduced loss/ 2 mixed findings/ 4 no data or too early to tell |
| Introducing product switching technology | Increase likelihood of detecting wrong scan | 7 | 3 with data suggesting reduced loss/ 4 no data or too early to tell |
| Using product recognition technology (apples for champagne etc) | Increase likelihood of detecting non-scan wrong scan | 6 | 2 with data suggesting reduced loss/ 4 no data or too early to tell |
Base: 34 interventions.
The strongest evidence of impact here is for non-scan identification interventions. Such solutions monitor SCO areas in real time and use AI-cameras to track products in order to identify whether they have been scanned or not by the customer. Where non-scan is detected the system can “nudge” the shopper by displaying a message on the screen (i.e., you did not scan the last item, please try again), which then gives the customer the option to self-correct to correct the error. If the customer ignores the “soft” nudge, staff will be alerted to intervene. Out of 14 companies testing such interventions, seven reported positive findings. Of these, one reported a 9% loss reduction in stores where this was used, another reported $136m in savings across 2000 stores in one year, the equivalent of a 0.13% sales increase. Two others reported a return on investment, with one suggesting investment recovery of 4.5 times to initial outlay.
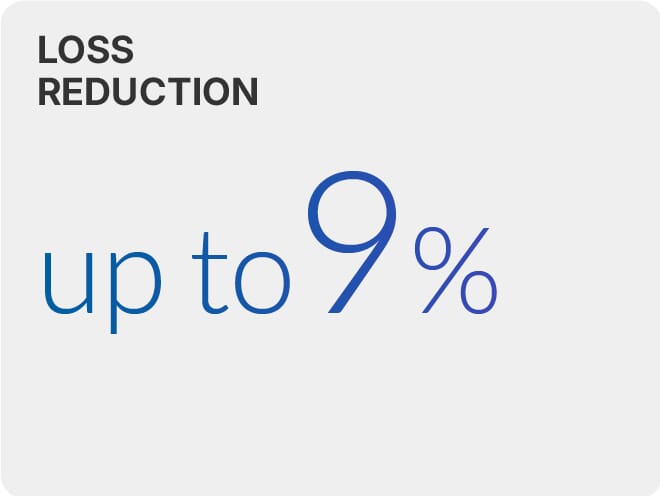
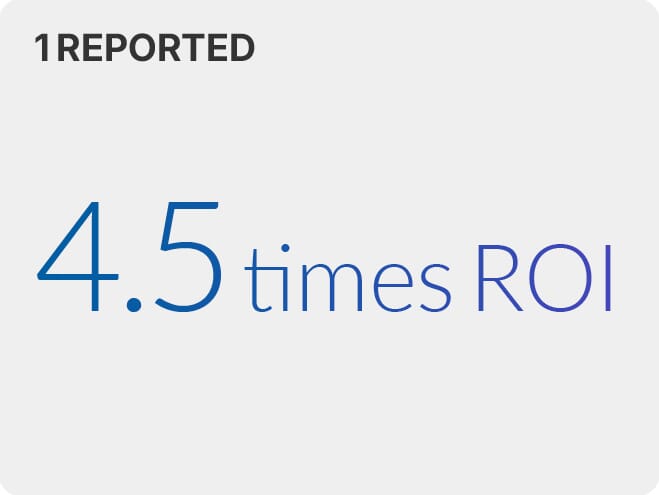
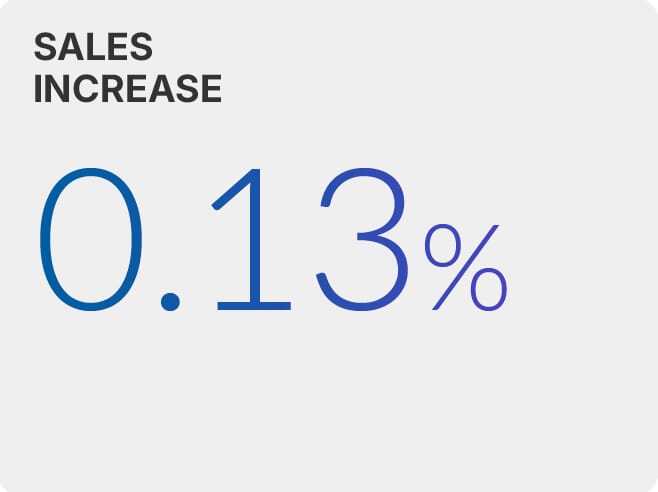
Figure 13: technology non-scan ID
The data in relation to other technology-based interventions had mixed findings:
- Bottom of basket technology: for the company with positive outcomes, it was reported there were savings of $500 per store per week. However, others suggested it was not a good return on investment yet.
- Product switch technology: three reported positive (but mixed) findings; one retailer reported it led to an increase in alerts (0.03% of transactions), another suggested there was significant variation across stores in terms of success and another reported increases in alerts but questioned the return on investment.
- Product recognition: where data were available, the outcomes were positive. One retailer reported that interventions reduced loss and another that the average value for the products sold from the product look up menu improved by €0.05 (+5%).
People-based interventions
In Table 11, we turn to people-based interventions. This presents the intended impact of the intervention, the number of retailers testing the intervention and whether there is any evidence of impact.
Table 11: Evidence of impact (people-based interventions)
| Intervention | Intended impact | Number of retailers testing | Evidence of impact on non-scan/ loss |
|---|---|---|---|
| Staff monitoring of SCO areas (for example, increasing/ reducing staff ratio from 1 in 4 to 1 in 6) | Increases guardianship in SCO areas | 11 | 1 positive / 10 no data or too early to tell |
| Introducing security guards to monitor SCO areas | Increases guardianship in SCO areas | 9 | 2 with data suggesting reduced loss/ 1 increased shrink / 6 no data or too early to tell |
| Enhanced supervisor training by third parties (hiring specialist training companies etc) | Reduce customer friction and potential customer frustrations | 5 | 2 with data suggesting reduced loss/ 3 no data or too early to tell |
| Introducing customer audits/ spot checks (for example, random checks on 10% of transactions) | Increase likelihood of detecting non-scan/ wrong scan | 4 | 2 with data suggesting reduced loss/ 2 no data or too early to tell |
Base: 29 interventions.
The evidence of impact in relation to people-based interventions was mixed. The best evidence of efficacy related to enhanced supervisor training and customer audits, though all people-based interventions showed some promise. Some care has to be taken here in how the data are interpreted. Several retailers did comment that staffing and supervisor training was likely to be important going forward, both in terms of reducing customer friction and in reducing SCO loss, though there is a lack of hard data to support this. SCO supervisors provide a guardianship function, they watch customers and help to amplify risk as customers know they are being watched. However, there are a number of challenges retailers are facing here in gauging the ratio of supervisors that should be allocated per the number of SCO machines, how long each supervisor should work in a SCO area before taking a break and crucially, how effective the deployment of SCO supervisors is for reducing loss. As one retailer said:
“They help customers and keep an eye on things, but it is hard to measure that effect.”
Many retailers were positive about enhanced supervisor training. However, only one study reported a link between training and loss improvements, one retailer reporting improvements in shrink (23bps) after enhanced training of SCO hosts. One retailer suggested having ample numbers of staff in SCO areas, who were well-trained, not only saw reduced loss, but improved customer experience and led to reductions in abuse against staff. In the same retailer this led to 30% reduction in response time to alerts and a 200% increase in scanning of large items by attendants (due to items formerly being left at the bottom of the basket). It is worth noting in Long Beach, California, a new regulation known as the “Safe Stores are Staffed Stores” requires (from 21st September, 2025) that at all times there needs to be one SCO host for every three open SCO tills, that SCO tills cannot accept any more than 15 items and that age restricted products need to go through an assisted till (Dabo, 2025).
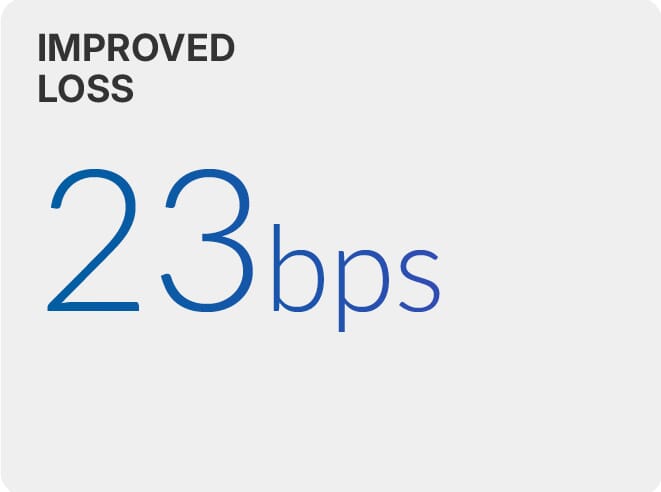
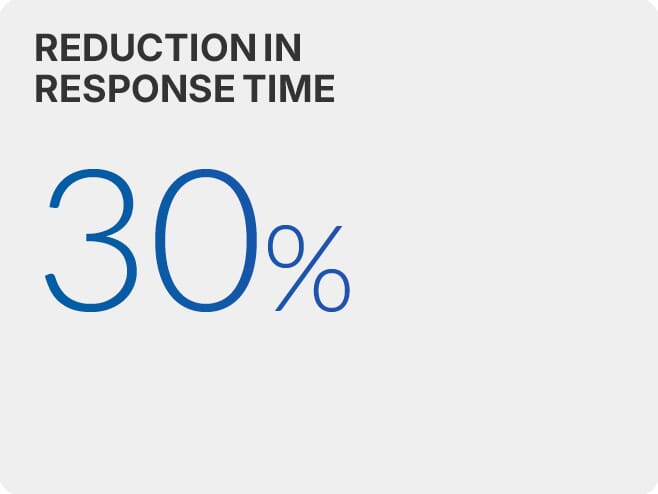
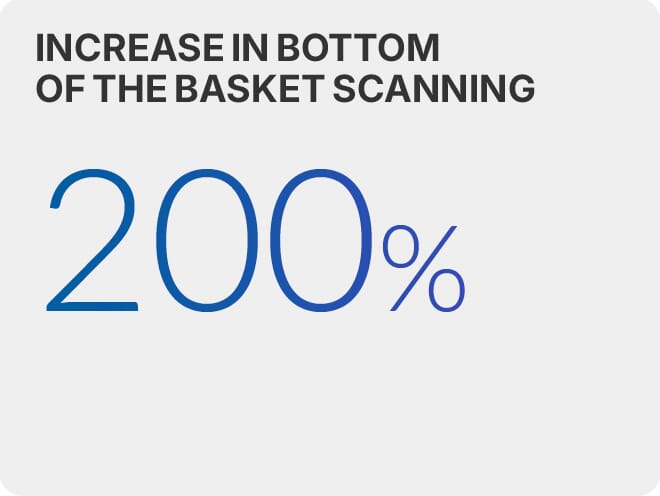
Figure 14: People – enhanced SCO supervisor training
The data in relation to other people-based interventions had mixed findings:
- [More] Staff monitoring SCO areas: one retailer reported loss improvement by 1% across 400 stores over a six-month period.
- Security guards: positive impacts were increased loss recovery (one retailer reported 60bps improvement in stock loss) and inventory improvement (0.1% was reported by one company). Another retailer also indicated that the deployment of security guards in SCO areas has led to a reduction in incidents of violence against staff.
- Customer audits: positive findings here from two studies indicate increased detection of potential loss and up to a 12% reduction in missed-scan incidents.
Overall, the data on efficacy of interventions need to be treated with caution due to the small number of companies testing the interventions, the varying test periods and numbers of test stores across each study. It is also evident that several companies are in the process of testing and have no outcome data at the moment.
It is hard to draw definitive conclusions about the efficacy of interventions as more systematic evaluations need to be completed. There was also a general view from many retailers and companies providing ‘non-scan’ solutions that this space is going through a period of rapid change. There are a number of technological advances in relation to AI solutions that will enable more effective product recognition, product tracking and customer tracking across stores. Such AI solutions could see the end of manual basket checks or weight controls to identify non-scan as AI solutions will have the accuracy to identify exactly what has not been scanned as customers use SCO. The core challenges around AI based solutions revolve around the use of biometrics, data protection of customers and whether AI based solutions represent a good return on investment. However, it is highly likely that such AI based solutions will work as part of a constellation of measures intended to reduce loss, including SCO design, exit gates and human interventions such as SCO supervisors. However, a core challenge for the industry is identifying which interventions appear to yield most success in reducing loss. It is here that a robust evidence base needs to be developed.
Conclusions and recommendations
This study has presented a comprehensive overview of losses generated by SCO. Based on data from 39 retailers, detailed analysis of ten datasets from retailers and numerous conversations with retailers it represents the most detailed study of the impact of SCO on retail businesses to date. In summary, the core findings suggest:
- SCO utilisation has increased since 2018: Of the 39 retailers returning data for the current 2026 study, it was evident that, in stores where SCO is present, this is now often the preferred form of customer transaction. In stores with SCO, an average of 54% of transactions now go through SCO.
- Store losses are likely to increase after SCO implementation: Analysis of loss data before and after SCO implementation estimate an average difference of +0.26 percentage points in the first year of operation. It is also observed that SCO increases loss by an average of 22% after implementation.
- SCO generates loss, but those losses are unlikely to be higher than those observed in 2018: It is estimated there is a difference of +0.42 percentage points between stores with SCO when compared to those without SCO. It is also observed that losses are 33% higher in stores with SCO. This is a lower difference in loss than previously reported in 2018.
- SCO utilisation studies clearly illustrate that as SCO transactions increase so does shrinkage: For every additional 1% of transactions through SCO there is between 0.030% to 0.048% of additional loss. This is higher than the 0.01% observed in 2018 (see Beck, 2018).
- SCO generates additional drivers of loss beyond shrinkage: For every additional 10,000 transactions there will be 1,000 additional help calls to staff, 100 card payment issues and slower staff reaction times (over 2 seconds). SCO loss also impacts on inventory records and on-shelf availability. Stores with a high SCO utilisation are often seen to have more inventory loss than stores with lower SCO utilisation. Indeed, higher SCO use is associated with lower stock availability.
- SCO losses are likely to be a greater proportion of overall business loss than in 2018: Beck (2018) observed SCO loss as % business loss to be 9.4%, our estimate from one company is 28.5%. While SCO loss does not appear to have risen significantly as a proportion of SCO sales, it is likely to represent a larger proportion of business loss. This is produced by increases in SCO utilisation.
- Most losses are generated by customers mis-scanning: Estimates from retailers suggest the most common type of loss is generated through missed-scan (1-4.8% of SCO transactions). However, walkaways/ whole basket voids are thought to generate the highest average loss per transaction (€88).
- Estimates of loss generated by malicious customer intent vary widely: This remains largely unknown as many retailers do not estimate this. Of those who do, the estimates vary widely. Indeed, our estimates point to anything from 6% to 80% of SCO non-scan as being malicious.
- There are several external drivers of SCO loss: Stores in higher-risk locations, in areas of high population density, with a young customer base with higher-than-average disposable income are most likely to record the highest losses.
- Although there is a paucity of data that measures the efficacy of interventions, the existing evidence suggests some interventions are promising: exit gates, personal display monitors and missed-scan ID have most data that suggests likely impact on reducing SCO loss. Retailers also indicate that some people-based interventions, such as staff monitoring SCO areas, are important, though there is a lack of hard data to support this. The evidence also shows that turning off weight controls increases loss, with one retailer reporting increased shrinkage of 20%.
Future business cases need to recognise that SCO generates loss. However, this is highly dependent on a number of factors: store location, customer base and interventions that are in place. At present it is unclear how much the losses generated by SCO are offset by savings on staff. This suggests a need for more return-on-investment studies going forward. With these findings in mind, there are four key areas where retailers need to focus:
- There needs to be development of more accurate measures of SCO loss and the wider impact of SCO on the business: It needs to be recognised that shrinkage is not an ideal measure of SCO loss. Most would confer that ‘shrinkage’ can only be viewed as a proxy measure of SCO loss. While this study has largely relied on shrinkage measures, it is evident that this is a measure of all store losses and such loss might not be attributable to SCO. Therefore, future assessment of SCO losses need to develop methods that isolate losses that are actually known to have been generated by SCO. This might mean that more reliable estimates are drawn from vendor analytics, rather than comparisons of store shrinkage rates. It is also evident there are potentially significant wider costs to the business: such as increased inventory inaccuracy and on-shelf availability challenges. These costs need to be better accounted for in SCO loss research and also factored into any future return-on-investment studies.
- Retailers need to better understand how individual store factors are associated with SCO loss: The data show that the location of stores and characteristics of the store customer base is associated with SCO loss. It is also evident that stores with high ‘risk’ exposure to crime will have higher SCO losses. This could have significant impact on decisions about where to implement SCO. However, the findings are based on data provided by a small number of retailers. Therefore, the evidence base needs to be built up to better understand how SCO loss is associated (a) with a wider set of store-based factors (such as turnover rates, customer footfall) and (b) external locational factors (i.e., where stores are located and characteristics of the customer population) across a larger sample of retailers. Such analysis would help to identify what store risk factors are associated with high SCO loss.
- More systematic understanding of the efficacy of SCO interventions is required: Many retailers are now using a range of interventions to reduce SCO loss. However, little is known about the efficacy of these interventions or the challenges faced in rolling out these interventions. More systematic evaluation of efficacy of interventions is required across the industry and also consideration of the unintended effects of interventions, for example, if the rates of abuse and violence against staff increase when doing bag audits or when completing age verification checks. The findings in this report can only be viewed as a starting point in understanding the efficacy of interventions. However, future learnings in relation to interventions need to be disseminated across the industry.
- Return on investment studies relating to SCO costs and benefits are required: to calculate the true cost of SCO, ‘return on investment’ studies are required that estimate the cost benefit to retailers. At a high level, such work would need to consider the balance between SCO loss; capital/ revenue costs of SCO and labour savings costs on staff. This might also consider calculating the wider unintended losses incurred by SCO, such as inventory inaccuracy and on shelf availability issues. Consideration might also be given to the extent SCO reduces queues and increases speed of customer flow through stores; whether removing till operators means there are fewer staff available on the shop floor to act as a deterrent for shoplifting and if SCO not only increases the potential for sales, but also increases the flow of potential thieves entering the store.
The development of SCO in retail has been piecemeal. It is an industry where some retailers have adopted various forms of SCO at a quicker rate than others. However, the industry appears to be at a stage where SCO is now the predominant type of transaction. Despite suggestions from some that customers do not like SCO and that SCO systems are a constant source of customer frustrations, it is evident that for many customers this is now the preferred way to checkout. While Beck (2018) set out a useful baseline of SCO losses in the early stages of its roll out, the current study identifies how SCO has grown and the associated extent of losses that have come with that growth. The findings in this report are very much ‘indicative’ of what is happening in the world of retail. The data are largely based on studies from 39 retailers, though the main findings are a plausible assessment of what is likely to be happening across the wider industry. The core future challenge is to monitor losses more routinely across the industry and to measure the efficacy of interventions designed to tackle those losses. Encouragingly, as one retailer said, SCO losses could be managed if the appropriate controls are put in place:
“We can run a store at 90% self-service and 1% stock loss in the right context and with the right controls.”
References and Appendices
Allen, A., Ekblom, P. and Gamman, L. (2024) Human-Centred Design to Improve the Self-Checkout Experience. ECR Retail Loss Group, February 2024.
Beck, A. (2011) ‘Self-scan checkouts and retail loss: Understanding the risk and minimising the threat’. Security Journal 24(3): 199-217.
Beck, A. (2018) Self-Checkout in Retail: Measuring the Loss. ECR Retail Loss Group, October 2018.
Beck, A. (2022a) Global Study on Self-checkout in Retail: Use, Impact and Control. ECR Retail Loss Group, March 2022.
Beck, A. (2022b) Self-checkout Management: Working on the ‘Front Line’. ECR Retail Loss Group, November 2022.
Beck, A., and Hopkins, M. (2017). ‘Scan and rob! Convenience shopping, crime opportunity and corporate social responsibility in a mobile world’. Security Journal, 30(4), 1080-1096. https://doi.org/10.1057/sj.2016.6
Dabo, M. (2025) California city orders retailers to staff self-checkout counters. Global Data, September 2nd, 2025.
Doruff, J., Ekblom, P. and Gamman, L. (2020) Self-Checkout Loss: Three Ways to Rethink SCO Design. ECR Retail Loss Group, November 2020.
Moraine, N. (2026) ‘Are New Self-Checkout Restrictions a Good Idea?’ RetailWire, March 16th, 2026.
Mullen, D. and Nott, G. (2025) ‘What shoppers really think about self-checkout machines revealed‘. The Grocer, 4th February, 2025.
Taylor, E. (2016). ‘Supermarket self-checkouts and retail theft: The curious case of the SWIPERS’. Criminology & Criminal Justice, 16(5), pp. 552-567. doi: 10.1177/1748895816643353
Appendix A: Methodology
An initial project launch took place online in June 2024. At the launch, a total of 85 retailers expressed an interest in being involved in the study. Once retailers agreed to participate in the study, they were then sent a data request form. The key data that were requested are outlined in Table A.
Table A: Key data requested from retailers: core themes
| Key theme | Core questions | Description |
|---|---|---|
| If any studies have been completed in relation to SCO, mobile or Scan & Go loss | Before and after studies | If any previous analysis has been completed comparing loss rates before and after SCO implementation in the same stores |
| With and without studies | If any previous analysis has been completed comparing loss rates in stores with SCO compared to stores without SCO | |
| SCO utilisation and loss | If any previous analysis has been completed looking at the relationship between SCO utilisation and loss | |
| The causes of SCO loss | Percentage of transactions with scan error; percentage of transactions with error that might be considered malicious; types of loss, for example items left at the bottom of the basket/ trolley, barcode switching, product stacking and average loss per transaction related to each. | Data collected (and previous analysis) that aims to identify SCO transaction error rates and causes of these error rates |
| Preventing SCO loss | Methods used to prevent SCO loss, for example turning off/ turning on weight controls, improved staff training for SCO supervisors, increased basket checks. | Data collected (and previous analysis) about interventions and nudges that are used to try and prevent loss and correct customer error. |
In total 39 companies completed the data request form. The majority of the returns (n=35) were from businesses that were classified as ‘grocery’, with four describing themselves as mixed food/clothing; furniture, clothing or department stores with operations across an average of 11 countries. However, most of the data in this report relate to stores located in the USA (n=13 returns) and the UK (n=12 returns).
As the data collection instrument was so broad, none of the respondents were able to answer all of the questions. There were good reasons for this:
- Many had not collected data on causes of SCO loss: For example, of the 39 respondents, only 12 were able to provide some data on causes of SCO loss. For some retailers with (for example) blanket SCO coverage across their stores, it was not possible to run studies that compared losses for stores with SCO compared to those without SCO (with and without studies);
- Relatively few respondents had collected data on the efficacy of more than one or two of the broad number of interventions that were asked about. In total, 25 respondents were testing SCO focused interventions, though robust data measuring efficacy of interventions were often not available.
Although many companies are using variations of SCO, data collection within retailers relating to SCO loss, causes of loss and efficacy of interventions is haphazard and not consistent. Indeed, common reasons why data could not be provided were because often relatively new SCO systems are in place and no loss data was yet mature or available. Where systems had been in place for a while often no reliable loss data had been collected as companies had (a) given no prior forethought to this or (b) put no resource into collecting SCO loss data. Indeed, in informal interviews with potential respondents, many commented on a lack of commitment from within their companies to robustly measure the impact of SCO on loss:
“The company will not put the effort to have inventory checks in a relevant amount of stores, which makes it hard to have “before/after” in a statistically sound way.
Still many decisions are made based on “common sense”, which again makes it almost impossible to assign time and resources to SCO data.”
In order to maximise data availability, the findings presented in this report are based on two broad types of data sources:
- Studies completed by retailers based on their own analysis: For example, their own studies of the impact of SCO on loss provided via the data collection proforma. A total of 39 retailers returned some data here.
- Datasets provided by retailers and then analysed by University of Leicester: For example, several respondents had collected data on shrinkage across a number of SCO stores but had only completed limited analysis in house. A total of 10 additional datasets were analysed for this study.
In addition, there were over 100 conversations with retailers on Teams calls about what data they held on SCO losses, how to interpret data they had supplied and what they saw as the main impact of SCO losses on the business.
It needs to be borne in mind that, as data for this study have been sourced from over 39 different retailers some caution needs to be expressed in relation to the findings presented. These primarily relate to:
- Calculation of SCO loss estimates: Most of the loss data presented in this report have been calculated by retailers and then submitted for the study. For example, retailers have conducted studies ‘in-house’ and then have returned the results via the proforma. Therefore, the shrink/ loss data provided by retailers are largely taken on trust.
- What shrinkage measures (internal validity): Throughout this report we use the terms ‘shrinkage’ and ‘loss’ interchangeably. Shrinkage is generally used as a measure of loss (though on occasion other losses are observed, such as those relating to on shelf availability and inventory accuracy). However, it needs to be borne in mind, there can be internal validity issues here. Shrinkage is a measure of the physical loss of inventory from a store’s recorded stock due to theft (both external and internal), administrative errors, vendor fraud, and product damage. The resulting discrepancy between book inventory and actual on-hand stock is the level of shrink. In relation to the findings of this study, there is an internal validity issue as ‘shrink’ is a measure of loss at store level, it is not a measure of loss generated by SCO within a store. Therefore, a SCO store could potentially have a high shrink rate that is not generated through SCO.
- How SCO losses are measured (external validity and reliability): There can also be external validity issues when using shrinkage as a measure across different companies. While shrink remains the industry standard for measuring loss, what is defined and included as shrink can vary from retailer to retailer. As Beck (2018:38) noted ‘there is little consensus across retailing what the term ‘shrinkage’ means’. Indeed, this assertion still holds true today.
- Differing sample sizes: Further to the challenges of measuring SCO loss, it needs to be borne in mind that, as data are being sourced from different retailers, sample sizes differ across studies, with some studies being more representative of the total number of stores across the business than others. As sample sizes are made up of a number of stores (these can be thousands in some cases), care also has to be taken in relation to potential outliers as some stores might record shrink levels way above or below the mean rate.
- Comparison groups: We also have to be mindful of the methods that are used to calculate SCO losses, in some cases simple before/ after comparisons are made, while in some comparison/ control groups have been used in studies. A core question here can be whether the comparison groups are accurately matched (according to store characteristics) to the test stores. In most cases, we are unable to ascertain if groups have been carefully matched based on similar characteristics (size, turnover, location etc) or if it is the case that a ‘convenient’ set of stores are selected for comparison purposes.
- Timeliness: The timeliness of data collection also needs to be borne in mind. Ideally, data need to be as contemporary as possible in order to reflect the current situation in relation to SCO losses (ethical approval for the project was granted through the University of Leicester Ethics Process. Where appropriate, Non-Disclosure Agreements were signed with participating retailers and companies providing analytical services/ interventions for retailers). To try and ensure data were relatively contemporary, all of the data included in the study were collected over the last four years.
A further limitation of the study is that we are unable to report on losses associated with different SCO variations: such as trolley Vs basket SCO, or hybrid versus non-hybrid. This is an area that might usefully be investigated in future research.
Finally, the sample group of 39 retailers are heavily drawn from the grocery sector. Indeed, 35 of the respondents were grocery. This is another obvious limitation. Indeed, future research might usefully explore loss in the non-grocery sector in more detail.
Appendix B: Relationship between SCO utilisation and rates of loss: Disaggregated data
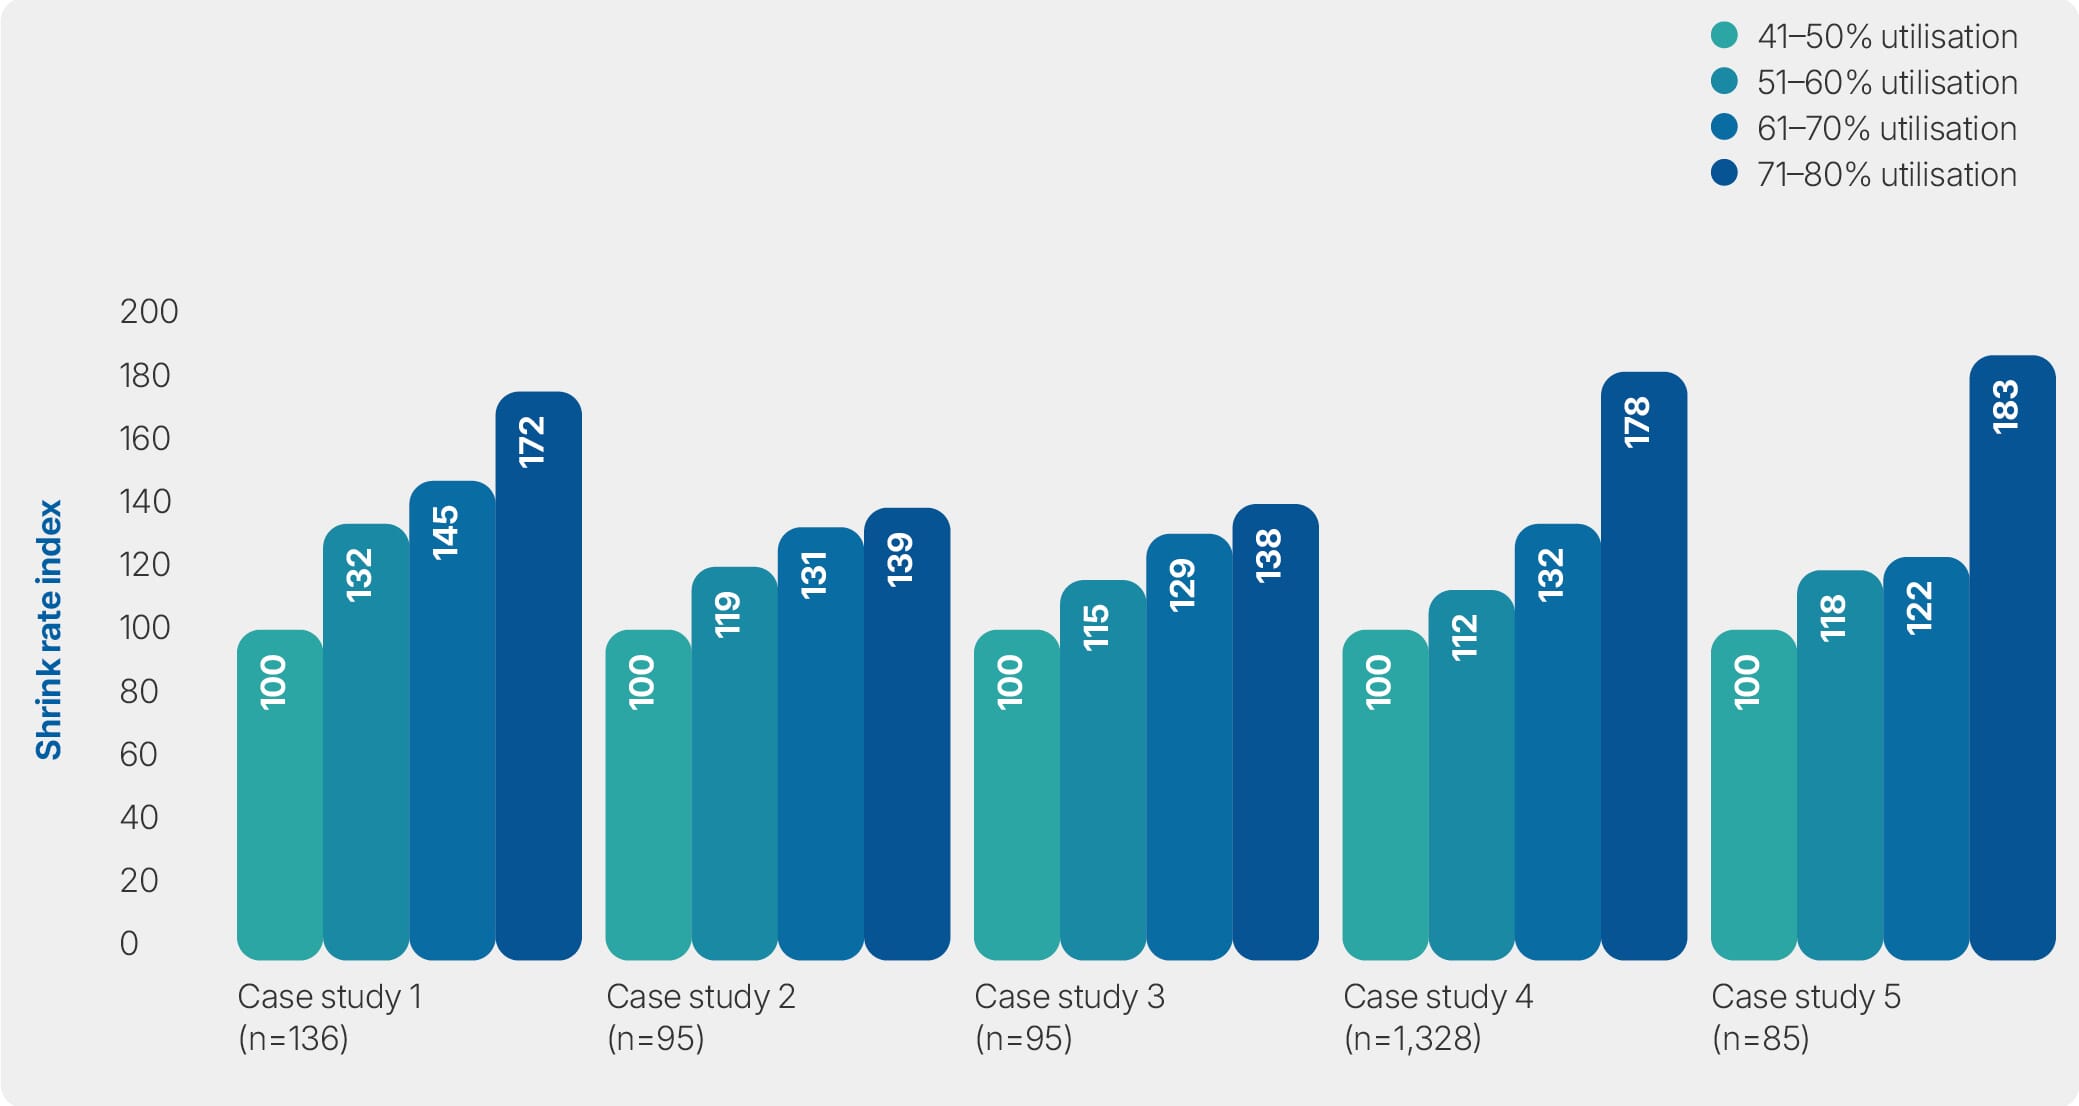
Appendix B: Relationship between SCO utilisation and rates of loss: Disaggregated data
Base: data from four retailers relating to 5 studies. All grocery. Data for case study 1 and 4 are from 2025. Case studies 2 and 3 relate to years (2023 and 2024). Data for case study 5 relate to a 34-week period in 2025.
Appendix C: Utilisation studies – data modelling
For each case study, a visual illustration of the relationship between SCO transactions and loss (in a scatterplot) is presented in Figures A, B, C and D. Here, it is clearly illustrated that as the percentage of SCO transactions increase, so does the rate of shrinkage (some further data on utilisation were analysed from a retailer with 85 stores with an average SCO transaction rate of 88%. Analysed over two time periods this revealed for time period 1, an increase of 1% of SCO utilisation would increase shrinkage by around 0.006%. For time period 2, an increase of 1% of SCO utilisation would increase shrinkage by around 0.009%. These low rates of shrink increase were produced by having a high number of SCO stores with high utilisation. Therefore, this is not comparable to the studies presented above and has been omitted).
The data presented in each scatterplot allowed for simple linear regression analysis to be completed. Regression is a statistical technique that allows us to predict the impact of one explanatory variable (such as SCO transactions) on another (such as loss/ shrinkage). The findings of the simple linear regression are presented in the right-hand side of the scatterplots.
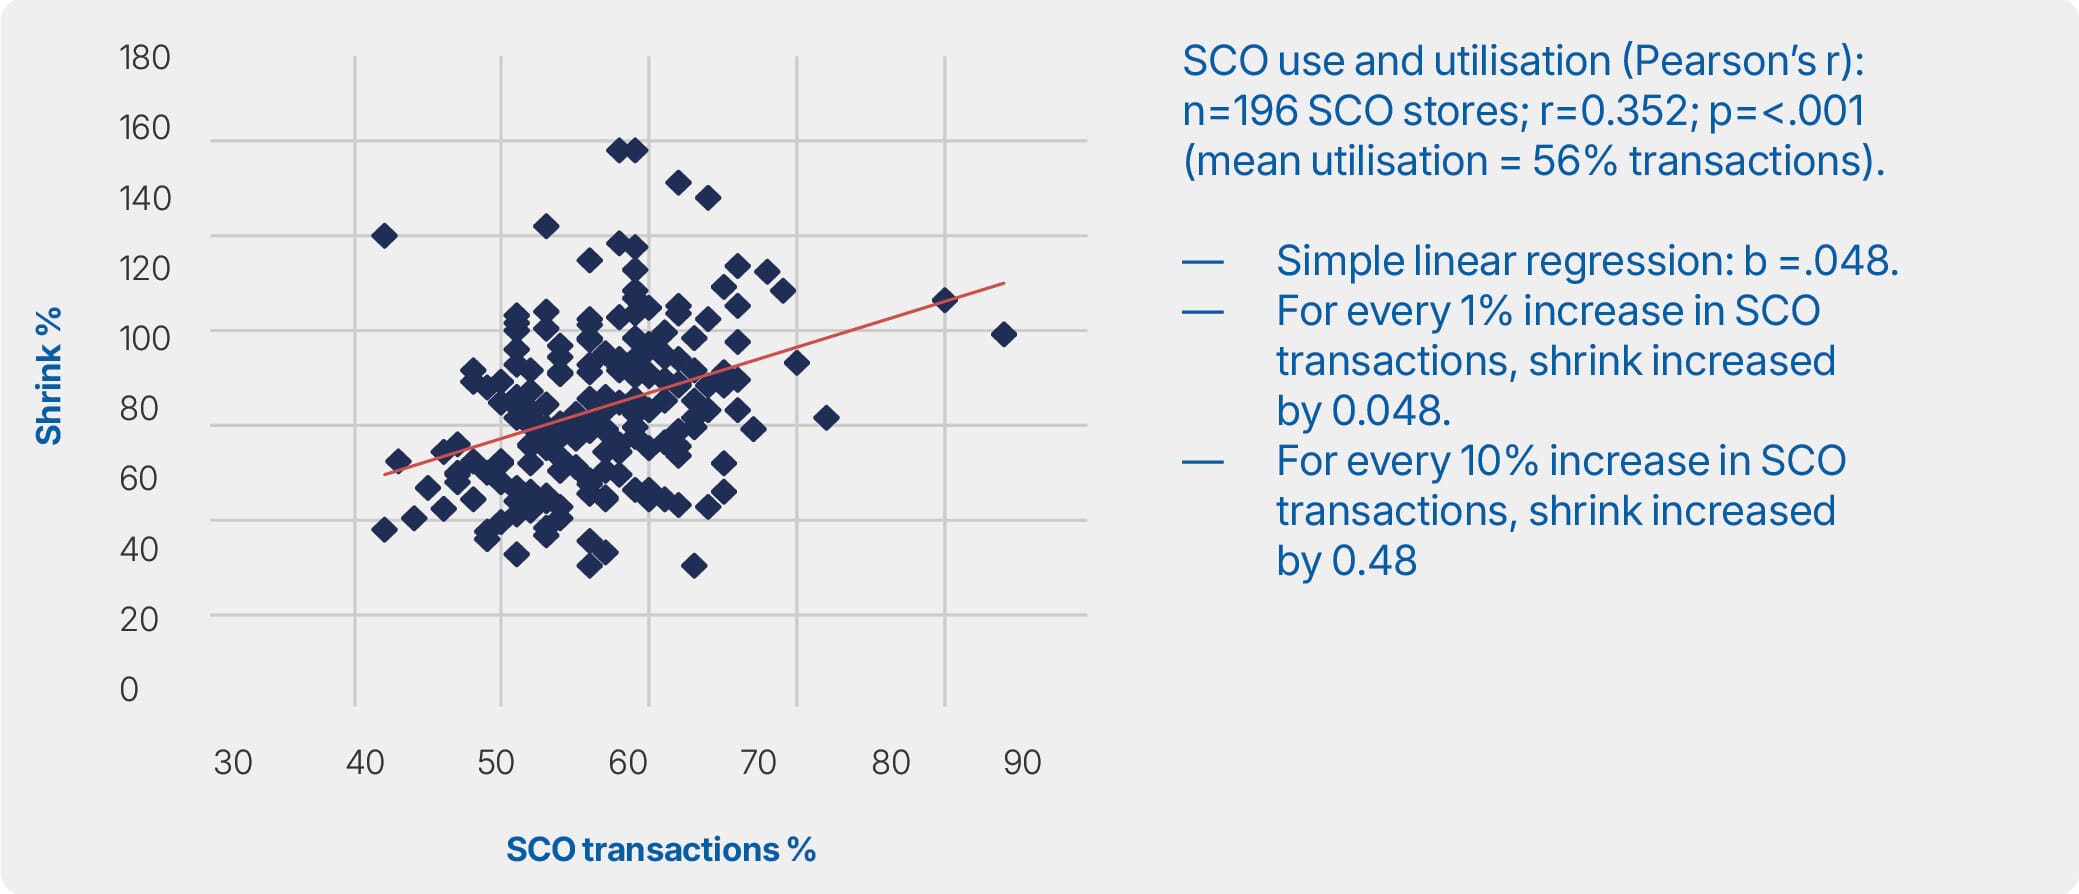
Figure A: Case study 1 – Utilisation and shrink
Base = 196 stores.
SCO use and utilisation (Pearson’s r): n=196 SCO stores; r=0.352; p=<.001 (mean utilisation = 56% transactions).
- Simple linear regression: b =.048.
- For every 1% increase in SCO transactions, shrink increased by 0.048.
- For every 10% increase in SCO transactions, shrink increased by 0.48
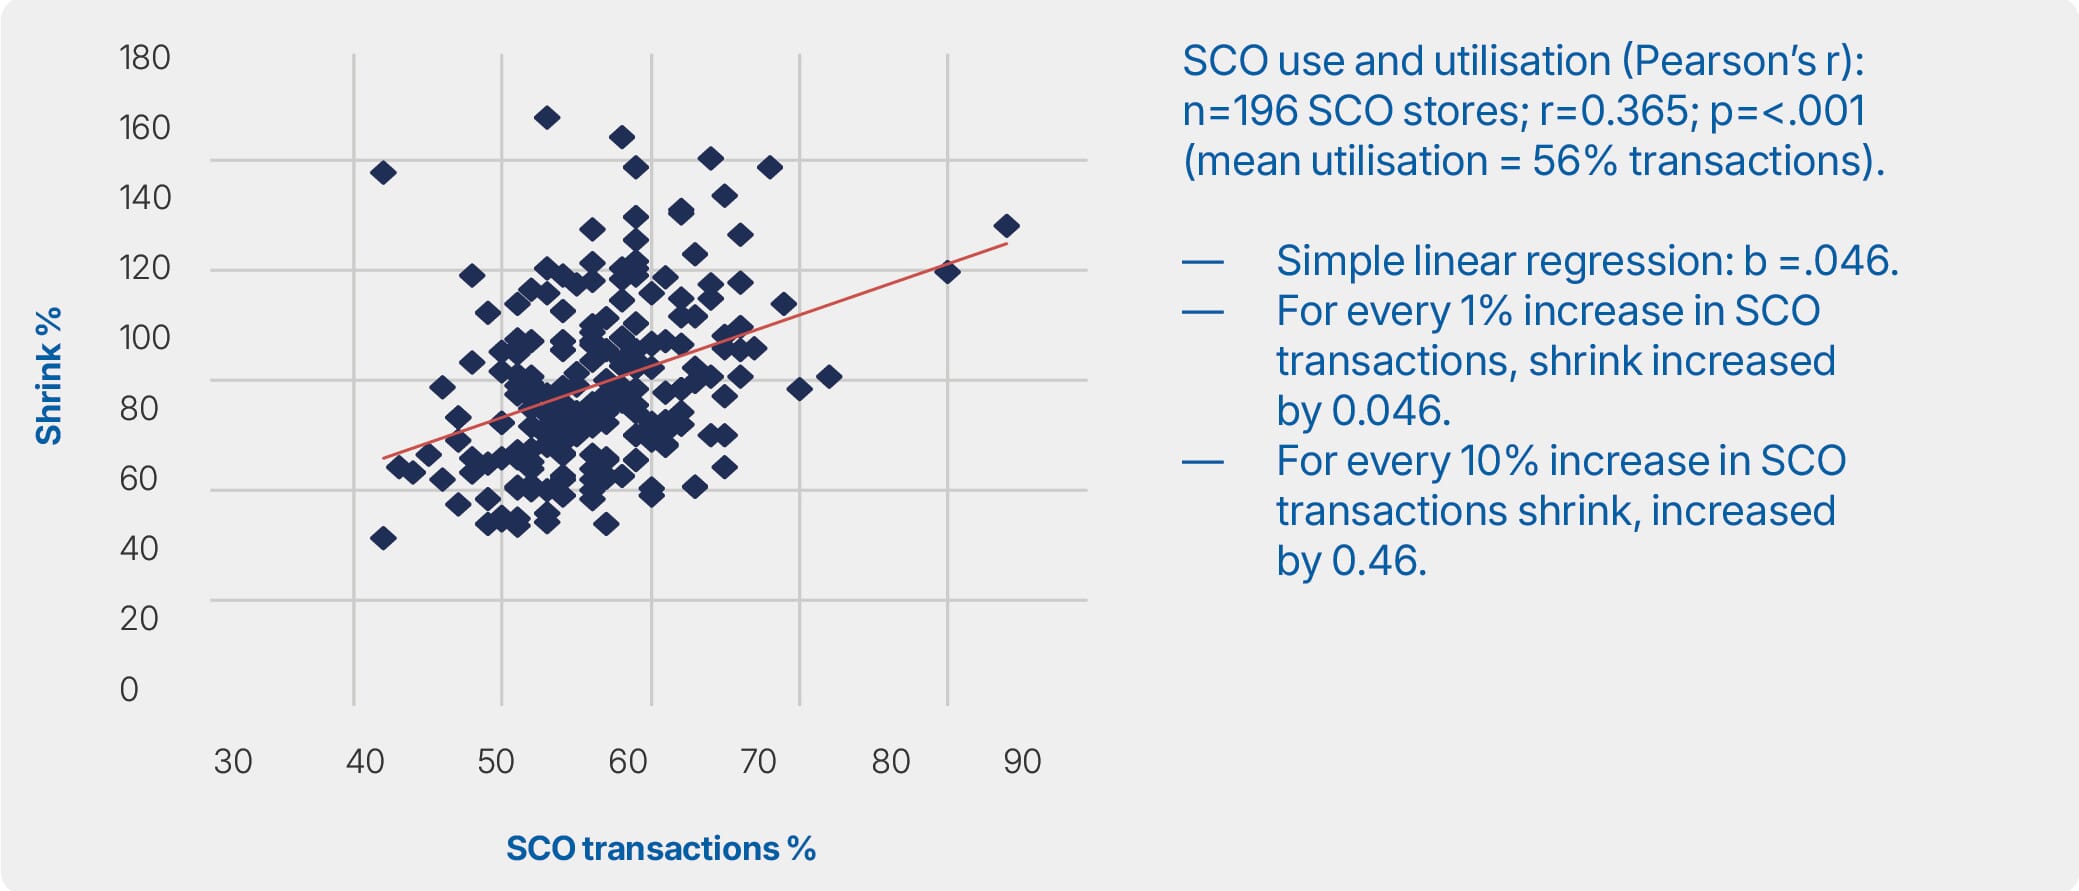
Figure B: Case study 2: utilisation and shrink
Base = 196 stores.
SCO use and utilisation (Pearson’s r): n=196 SCO stores; r=0.365; p=<.001 (mean utilisation = 56% transactions).
- Simple linear regression: b =.046.
- For every 1% increase in SCO transactions, shrink increased by 0.046.
- For every 10% increase in SCO transactions shrink, increased by 0.46
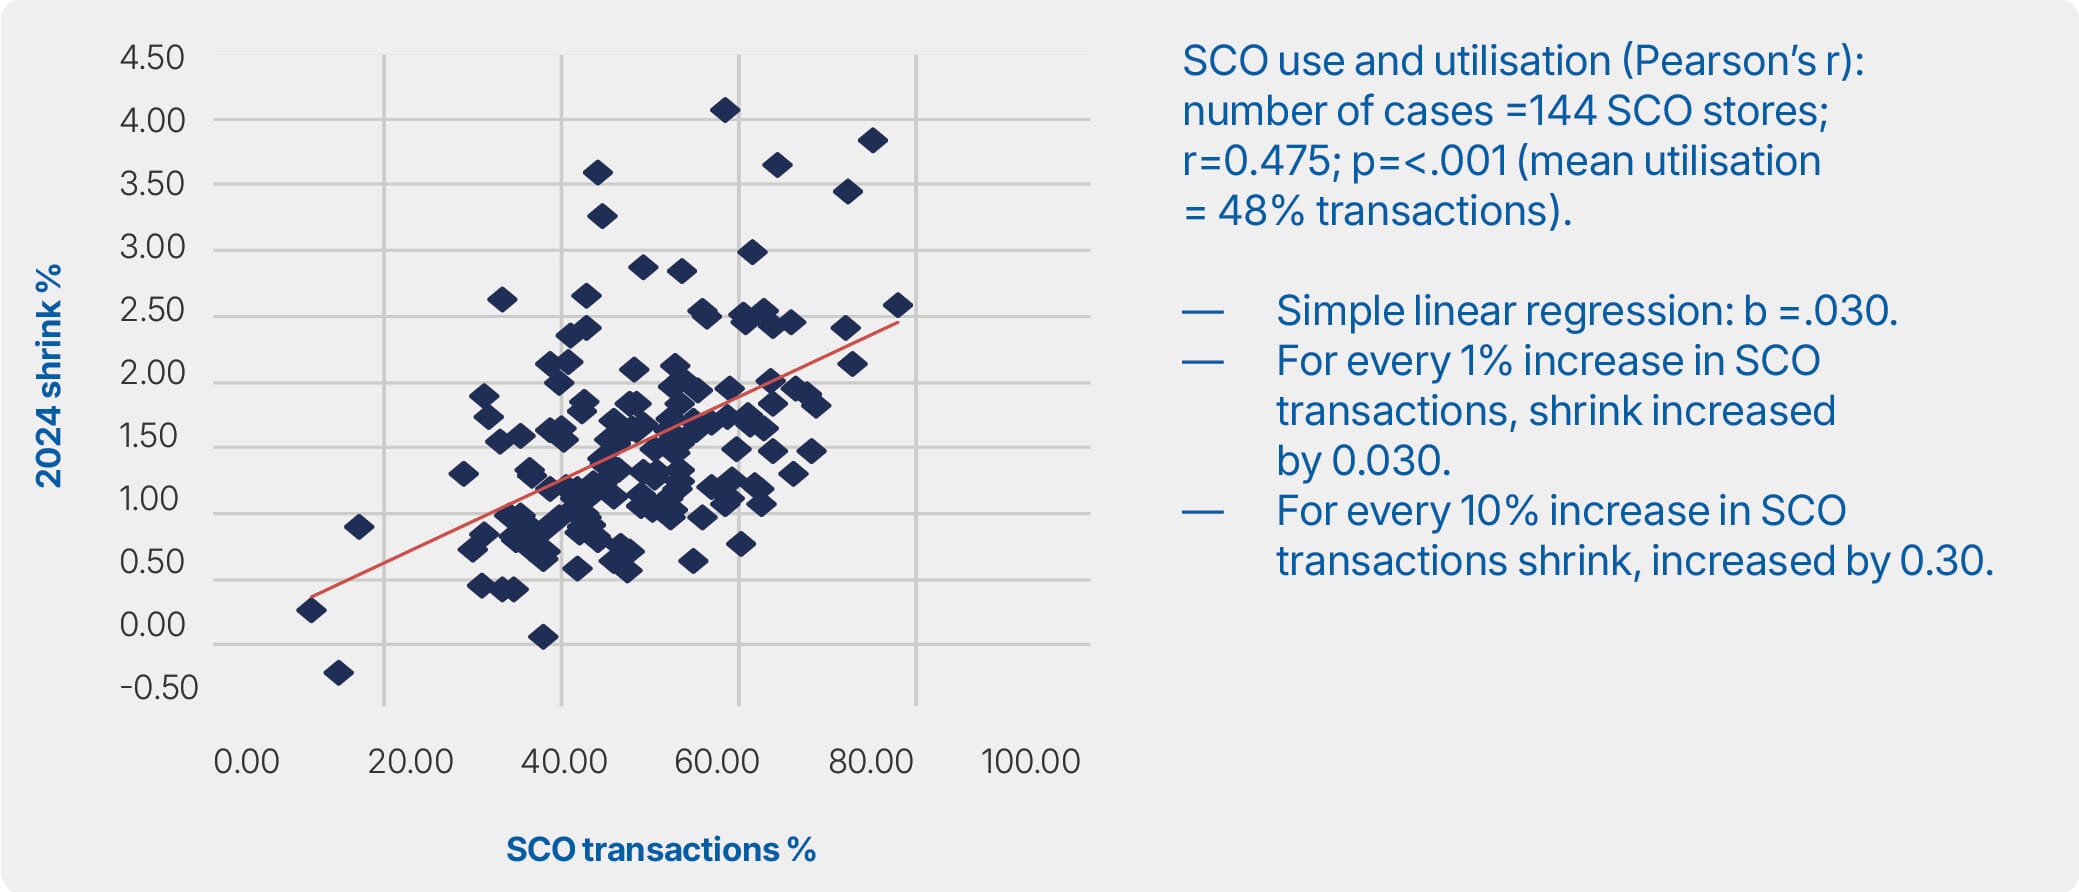
Figure C: Case study 3 – utilisation and shrink
Base = 144 stores.
SCO use and utilisation (Pearson’s r): number of cases =144 SCO stores; r=0.475; p=<.001 (mean utilisation = 48% transactions).
- Simple linear regression: b =.030.
- For every 1% increase in SCO transactions, shrink increased by 0.030.
- For every 10% increase in SCO transactions shrink, increased by 0.30.
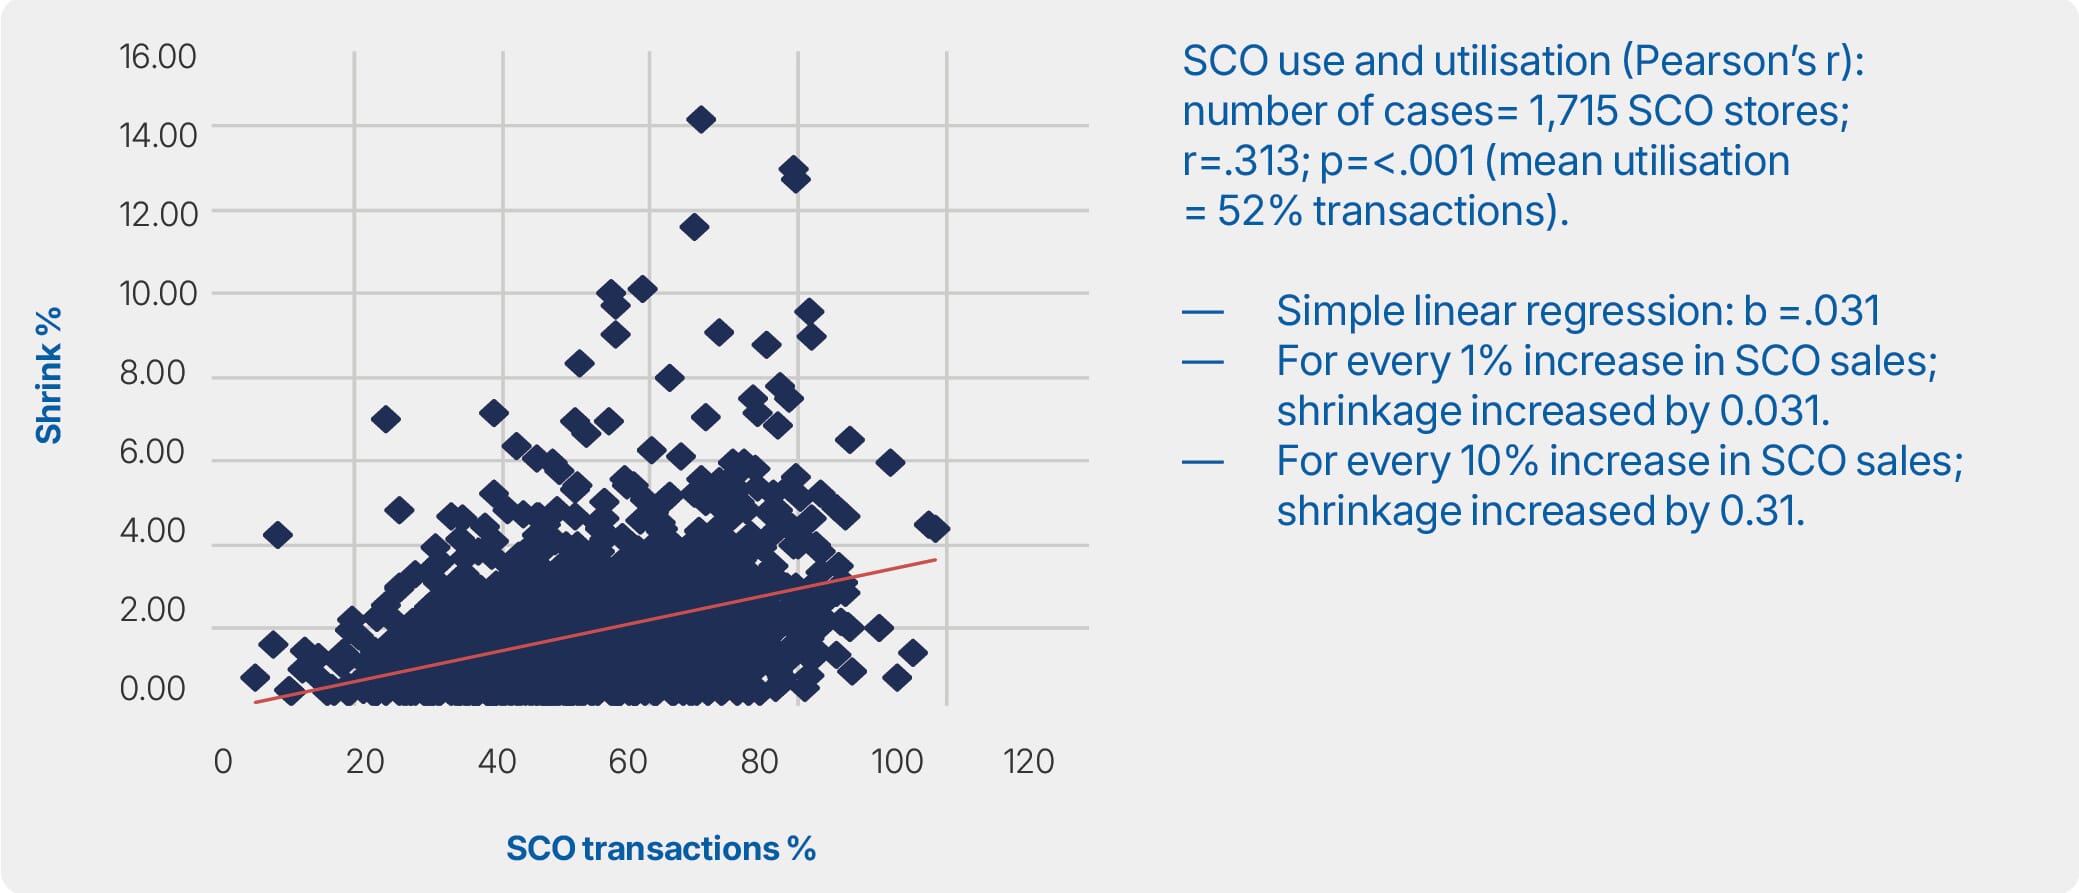
Figure D: Case study 4 – utilisation and shrink
Base: all 1,715 SCO stores.
SCO use and utilisation (Pearson’s r): number of cases= 1,715 SCO stores; r=.313; p=<.001 (mean utilisation = 52% transactions).
- Simple linear regression: b =.031
- For every 1% increase in SCO sales; shrinkage increased by 0.031.
- For every 10% increase in SCO sales; shrinkage increased by 0.31.
Appendix D: External factors that drive SCO loss – data modelling
Model 1: USA retailer with 2,528 stores
The dependent variable was whether a store had levels of shrink that were above the median level. For 2024 median shrink was 2.03 (n=1,190 stores were above this) and for 2025 it was 2.11 (n=1,278 stores were above this). The findings of the model for 2025 are outlined in the tables below (similar results were observed in the model for 2024). The table presents the statistically significant predictors in the model, that is, those that did not occur by chance. The columns (from left to right) show:
- the regression weight column (B) indicating the strength and direction of the relationship in the model;
- statistical significance showing the level of statistical significance of the variable in the model;
- the odds ratio showing the increased or decreased chances of falling into the higher shrink group if the factor is present.
The model (Table A) shows that:
- If a store has SCO in place, it increases the chances of being in the above median shrinkage group by over 3 times;
- If a store is located in an elevated risk location the chances of being in the above median shrinkage group (compared to those in the low-risk group) increase by over 4 times.
Table A: Predictors of above median shrink in all stores
| Variable | B | Statistical Significance | Odds Ratio |
|---|---|---|---|
| Store has SCO in place for over 12 months | 1.236 | <.001 | 3.44 |
| Store risk rating (low group – reference) | <.001 | ||
| Store risk rating (elevated) | 1.439 | <.001 | 4.216 |
| Store risk rating (moderate) | .649 | <.001 | 1.914 |
| Store risk rating (mild) | .237 | .013 | 1.268 |
Base = 2,477 stores: Nagelkerke R = 0.128 (around 13% of variance in shrink is predicted by the variables in the model). Nagelkerke R is an adapted version of the R² (coefficient of determination) that can be used in logistic regression. It approximates the proportion of the total variance in the data that the model accounts for (ranging from 0 to 1).
The next step was to run this for SCO stores only (Table B). For the 2025 data, elevated risk is still the main predictor, though this is not as prominent as in the 2024 model. This shows that, if a store has elevated crime risk the chances of being in the above median shrinkage group (compared to those in the low-risk group) increase by nearly 3 times.
Table B: Predictors of above median shrink in SCO stores
| Variable | B | Statistical Significance | Odds Ratio |
|---|---|---|---|
| Store risk rating (low group – reference) | .002 | ||
| Store risk rating (elevated) | 1.635 | .003 | 2.938 |
| Store risk rating (moderate) | .773 | .99 | 1.215 |
| Store risk rating (mild) | .229 | <.001 | 1.829 |
Base = 1201 SCO stores: Nagelkerke R = 0.035 (around 3.5% of variance is predicted by the variables in the model).
Model 2: UK retailer with 2,304 stores
This retailer provided data in relation to 2,304 stores. Of these stores, 73% (n=1,715) had SCO in place. For each store, shrink figures (expressed as a mean over three quarters in 2024-25) were made available. When shrink figures were compared for the SCO versus non-SCO stores, the SCO stores had an average shrink rate of 1.96% compared to 1.35% for the non-SCO stores (this is statistically significant using a T Test to compare means across the two sample groups (t=10; df 1,257; p=<.001; d=.442)), an absolute difference of 0.61 percentage points; with SCO stores having a relative average of 31% higher shrink.
While the data show there is a relationship between SCO and shrinkage, the data also allowed analysis to be conducted that measured the impact of a range of factors on shrink such as store location, crime risk factors and the characteristics of the store customer base. A number of these variables had a statistically significant relationship to shrinkage. These variables are presented in Table C below.
Table C: Explanatory variables
| Variable | Description |
|---|---|
| External risk | Whether the store was in a locale that was considered high crime. |
| SCO store | If the store had SCO. |
| SCO count | If the store had 5 or more SCO machines. |
| Average SCO sales | If over 50% of sales go through SCO. |
| Urbanity/ population density | If the store is located in a high population density area. |
| Non-residential customer base | If over 20% of customers were non-residential. |
| Customers over age of 60 | If over 20% of customers were over 60 years of age. |
| High student customer base | If over 20% of customers are students. |
| High customer base are young singles with above average direct income | If over 20% of customers are young singles with above average disposable income. |
Two logistic regression models were then run to test for the impact of these variables on (1) shrinkage across all stores and (2) shrinkage in SCO stores. Logistic regression tests for statistical significance of a number of explanatory variables on an outcome variable, though most importantly it enables us to identify predictors of high shrinkage. The outcome variable in both models is whether a store has shrinkage at a level above the median point. The median level shrinkage was 1.4%; therefore, the models aimed to identify what factors predict that stores will have shrinkage above this number. For the first model presented below, the predictor variables SCO count and average SCO sales are not included as the first stage of the process was to initially ascertain if simply ‘being a store with SCO’ was having an impact on shrinkage when controlling for the other predictor variables in the model. Internal risk has been excluded in both models as this is highly correlated with shrinkage and therefore, it is assumed ‘shrinkage’ and ‘internal risk’ are measuring similar things.
The output from model 1 is presented in Table D. The columns (from left to right) show:
- the regression weight column (B) indicating the strength and direction of the relationship in the model;
- statistical significance showing the level of statistical significance of the variable in the model;
- the odds ratio showing the increased or decreased chances of falling into the higher shrink group if the factor is present.
The model shows there are a number of clear predictors of being a ‘high shrink’ store:
- If a store is in a high population density location, it increases the chances of being in the above median shrinkage group by over 2.9;
- If a store has SCO in place, it increases the chances of being in the above median shrinkage group by 2.8;
- If a store is located in an area where over 20% of customers are young singles with higher-than-average DI, it increases the chances of being in the above median shrinkage group by 2.8;
- If over 25% of store trade is non-residential, it increases the chances of being in the above median shrinkage group by 1.6;
- If over 25% of customers are aged over 60, it reduces the chances of being in the above median shrinkage group.
Table D: Predictors of above median shrink in stores
| Predictor Variables | B | Statistical Significance | Odds ratio (ranked high to low) |
|---|---|---|---|
| Area of high population density | 1.069 | <.001 | 2.912 |
| Is this a SCO store | 1.030 | <.001 | 2.800 |
| Over 20% of customers are young singles with higher-than-average DI | 1.027 | <.001 | 2.793 |
| If non-residential trade over 25% | .501 | <.001 | 1.650 |
| If over 25% of customers are over 60 | -.540 | <.001 | .583 |
Base = 2,304 cases. Nagelkerke R square = .280 (around 28% of variance is predicted by the variables in the model).
A similar model was then run for the SCO stores to try and tease out what might predict high shrinkage (and principally to identify what the SCO effect is here). In this model the predictor variables ‘SCO count’ and ‘average SCO sales’ are included as these variables are only relevant to SCO stores. The output is presented in Table E. This shows there are a number of clear predictors of being a ‘high shrink’ store:
- If a SCO store is in a high population density location, it increases the chances of being in the above median shrinkage group by over 2.7;
- If a store is located in an area where over 20% of customers are young singles with higher-than-average DI, it increases the chances of being in the above median shrinkage group by 2.3;
- If a SCO store has SCO sales above 50% of all sales, it increases the chances of being in the above median shrinkage group by 2.1;
- If over 25% of store trade is non-residential in a store with SCO, it increases the chances of being in the above median shrinkage group by 1.5;
- If over 25% of customers are aged over 60 in a SCO store, it reduces the chances of being in the above median shrinkage group.
Table E: Predictors of above median shrink in SCO stores
| Predictor Variables | B | Statistical Significance | Odds ratio (ranked high to low) |
|---|---|---|---|
| Area of high population density | 1.018 | <.001 | 2.768 |
| Over 20% of customers are young singles with higher-than-average DI | .855 | .012 | 2.351 |
| If SCO sales above 50% | .766 | <.001 | 2.150 |
| If non-residential trade over 25% | .456 | <.001 | 1.578 |
| If over 25% of customers are over 60 | -.538 | <.001 | .584 |
Base = 1,715 SCO stores. Nagelkerke R square = .248 (around 25% of variance is predicted by the variables in the model).
Appendix E: The efficacy of interventions – additional tables
Below, we outline the data available in relation to interventions. This includes:
- What the intervention was;
- How many retailers have/ are testing the intervention;
- Test time periods: the duration of the test periods;
- How many of those retailers were able to provide some findings/ outcome data. This includes whether that outcome data included numeric data (i.e., on changes to shrink);
- The number of stores where the intervention was tested;
- Whether the key outcome measures indicated a positive, or negative impact.
Table A presents the data for design-based interventions, Table B technology-based interventions and Table C people-based interventions.
Table A: Design-based interventions
| Intervention | Number of Companies testing | Test time periods | Number with outcome data (numeric) | Number of Test Stores | Outcomes |
|---|---|---|---|---|---|
| Introducing exit gates/ with or without receipts | 17 | 1 to 12 months | 8 (6) | 1490 | 7 studies identified reduced shrink/ 1 mixed findings/ 9 no data |
| Adding Public Display Monitors to SCO | 11 | 3 to 12 months | 7 (2) | 2470 | 5 studies identified reduced shrink/ 2 mixed findings/ 4 no indication |
| Limiting the number of items that go through SCO (10 items only/ baskets only etc) | 7 | Various ‘on’/ ‘off’ periods | 4 (1) | 1976 | 2 studies identified reduced shrink/ 1 mixed findings/ 1 no change/ 3 no data |
| Turning off weight controls | 6 | 1 week to 18 months | 5 (5) | 113 | 5 studies = increase in shrink/ 1 no data |
| Changing weight controls: Variations in weight controls | 6 | 3 to 12 months | 6 (6) | 2347 | 6 = no impact |
| Closing SCO off at busy times | 6 | Unknown | 1 (0) | Unknown | 1 positive, but no data |
| Improving product menu | 3 | Unknown | 0 | Unknown | 0 positive |
Base: retailers returning interventions data.
Table B: technology-based interventions
| Intervention | Number of retailers testing | Test time periods | Number with indication of outcome (number with numeric indicators) | Number of Test Stores | Outcomes |
|---|---|---|---|---|---|
| Introducing product non-scan identification (such as skip scan/ SAI etc) | 14 | 2 weeks to 12 months | 10 (4) | 7521 | 7 studies identified reduced shrink (or other positive outcomes)/ 3 mixed findings/ 4 no indication |
| Introducing bottom of basket recognition/ technology | 7 | 2 weeks to 12 months | 3 (3) | 867 | 1 study identified reduced shrink/ 2 mixed findings/ 4 no indication |
| Introducing product switching technology | 7 | 2 to 6 months | 3 (3) | 1020 | 3 studies with mixed findings/ 4 no data |
| Using product recognition technology (apples for champagne etc) | 6 | 3 to 6 months | 2 (1) | 759 | 2 studies identified reduced shrink/ 4 no data |
Base: retailers returning interventions data.
Table C: People-based interventions
| Intervention | Number of Companies testing | Test time periods | Number with outcome data (numeric) | Number of Test Stores | Outcomes |
|---|---|---|---|---|---|
| Staff monitoring SCO areas | 11 | Up to 6 months | 1 (0) | 3815 | 1 positive, but no data |
| Introducing security guards to monitor SCO areas | 9 | 12 weeks to 12 months | 3 (2) | 125 | 2 studies identified reduced shrink/ 1 increased shrink/ 6 no data |
| Enhanced supervisor training by third parties (hiring specialist training companies etc) | 5 | NA | 2 (1) | 6 | 2 studies identified reduced shrink/ 3 no data |
| Introducing customer audits/ spot checks (for example, random checks on 10% of transactions) | 4 | 1 to 3 months | 3 (2) | 450 | 2 studies identified reduced shrink/ 2 no data |
Base: retailers returning interventions data.
Disclaimer
The research for this report was supported by ECR Retail Loss. The report is intended for general information only; it is based upon a review of the available literature together with primary research undertaken with retail organisations worldwide. Individuals or companies are advised to seek professional guidance regarding their specific needs and requirements prior to taking any actions resulting from anything contained in this report. Any such actions taken by individuals or companies are entirely at their own risk. Companies are also responsible for assuring themselves that they comply with all relevant laws and regulations, including those relating to intellectual property rights, data protection and competition laws or regulations. The images used in this document do not necessarily reflect the companies taking part in this research.
© June 2026, all rights reserved. Research commissioned by ECR Retail Loss.
About the Author
Matt Hopkins is Professor of Criminology at the University of Leicester, UK. Over the past 30 years his research has focused on various aspects of crime and loss against businesses. This has included a PhD thesis exploring abuse and violence against business, development of the UK Home Office commercial victimisation survey, organised crime in the retail space, and self-checkout in retail.
To contact the author: mhopkins@le.ac.uk
If you’re looking for citable facts and figures from this report, visit our data points summary.
Acknowledgements
The authors are grateful to all companies that participated in this research project by sharing their data, experience and knowledge in interviews and during workshops.
About ECR Retail Loss
ECR Retail Loss is part of ECR Community, a voluntary and collaborative retailer-manufacturer platform with a mission to ‘fulfil consumer wishes better, faster and at less cost’. Over the last 26 years, the Group has acted as an independent think tank focused on creating imaginative new ways to better manage the problems of loss and on-shelf availability across the retail industry. Championing the idea of Sell More and Lose Less, the group is open for any retailer and manufacturer to join.
For further information: https://www.ecrloss.com
Research commissioned by ECR Retail Loss is made possible by independent research grants provided by Axon, Checkpoint Systems, NCR Voyix, Retail Insight, RGIS and Vusion.
Research Grant Providers:






This report was made possible by a special additional research grant from Everseen.



